
Poorna Manasa Bhamidimarri1, Bassam Mahboub3, Laila Salameh3, Mahmood Hachim4, Qutayba Hamid2, Rifat Hamoudi1,2
1Sharjah Research Academy, Sharjah, UAE
2College of Medicine, University of Sharjah, Sharjah, UAE
3 Department of Pulmonology, Rashid Hospital, Dubai, UAE
4 College of Medicine, Mohammed Bin Rashid University, Medicine and Health Sciences, Dubai, UAE
Corresponding author email: rhamoudi@sharjah.ac.ae
Abstract #
Asthma has been classified into subtypes based on pathophysiological conditions, immunological markers, FEV1, and FENO values. Nevertheless, there has been no single biomarker that can differentiate between different subtypes owing to its heterogenicity. These limitations urged to development of mathematical models to deduce specific differential biomarkers for various phenotypes of asthma with the help of a systems biology approach. The current study aims at understanding the differential mRNA biomarker for severe asthma and deduces a mathematical cutoff value to predict severity from healthy control in a non-invasive approach. Here, we report two salivary mRNA biomarkers, amphiregulin (AREG) and fibrillin 2 (FBN2) that can differentiate severe asthma patients from healthy control samples collected from UAE residents. The information from the hospital records and the molecular profiling in the laboratory facilitated to the discovery of the above biomarkers.
Key Words: biomarkers, mathematical modeling, severe asthma
1 Introduction #
At present, asthma cannot be defined by a single condition but has generally been described as airway hyperresponsiveness and is often associated with allergies. Asthma can be broadly classified into Th2-associated and Non-Th2-associated inflammatory responses (Wenzel, 2012). Further classified into subtypes based on pathophysiological conditions, immunological response, the fraction of exhaled nitric oxide (FENO), and forced expiratory volume in one second (FEV1) levels(Agache et al., 2018). The complexity in determining asthma type also falls on various environmental factors like exacerbations, infections, pollutants, allergens, and other unidentified triggers. Hence, a similar treatment cannot be provided to all the subtypes. In order to provide successful treatment to the patients recruited by asthma conditions, it is important to identify a specific biomarker for every sub-phenotype that can be considered as a therapeutic target. In view of the heterogenicity, unidentified triggers, and varied immunological responses, there is a need for a mathematical approach to decode the complexity and arrive at a single specific biomarker from large datasets (Tang et al., 2020).
In the global context, the systems biology approach was used to analyze the big data available from the databases and hospital records to manage asthma in the respective local populations (Richards et al., 2018). Some of the biomarkers identified using genomics, transcriptomics, epigenetics, and other “omics” technologies have been reviewed by Tang et al and the importance of enlightening clinicians with systems biology tools was also emphasized (Tang et al., 2020). By using a similar approach, a model to predict type 2-high asthma with 100% positive predictive value was developed which was otherwise solely identified using conventional markers like serum IgE levels, eosinophilic count, and FENO levels but were not consistent in detection(Silkoff et al., 2017).
The present study was considered to apply system biology tools to detect severe asthma conditions among the UAE population with the help of linear mathematical modeling and omics technology. In UAE, approximately 8-10% of adults were known to suffer from asthma(B. H. S. H. Mahboub et al., 2010). According to recent reports, this percentage is going to increase and it is the need of the hour to rightly distinguish severe asthma patients from mild/moderate asthmatics to improve the treatment prospects (B. H. Mahboub et al., 2012). Asthma can be cured if treated properly and a few earlier reports proved that specific treatments help patients to recover faster. The major challenge is to identify the appropriate biomarker and corresponding therapeutic target (Tiotiu, 2018). At the moment, the only method to overcome the problem is record keeping of the patient history, the right clinical classification, and analyzing the patient’s molecular profile by genomics, transcriptomics, and epigenetics and correlating all the parameters by machine learning tools (Vijverberg et al., 2013). By this approach, a specific biomarker for each subtype can be identified and a personalized treatment can be prescribed. The other important outcome of the study would be to identify markers that can predict the possibility of an individual developing severe asthma conditions in the future which helps clinicians to advise patients for any lifestyle-related modifications to avoid the disease development.
The reports from the laboratory earlier this year have established periostin (POSTN)(Hachim et al., 2020) and amphiregulin (AREG) (Hachim et al., 2020) as important biomarkers to differentiate non-severe and severe asthmatics from healthy control based on the studies on bronchial epithelial cells and ELISA method. The genome-wide association studies (GWAS) performed for specific populations worldwide in the context of asthma reported population-specific genes and possible mutations(Altman & Busse, 2017). From such studies, using image filtering algorithms and in-house developed pipelines, genes that differentially expressed for severe asthmatics were deduced(Hachim et al., 2019). These differentially expressed genes (DEG) were considered for the current study to identify specific mRNA biomarkers for severe asthma.
The major clinical manifestation of asthma is bronchi constriction which leads to difficulty in breathing. The tissue remodeling events occurring due to immunological response inside the airways and the modulatory effects of certain epidermal growth factors result in bronchi constriction(Enomoto et al., 2009). Hence, most of the studies related to asthma focus on tissue remodeling mechanisms. The major structural cell types that involve in tissue remodeling are epithelial cells, fibroblasts, and smooth muscle cells(Erle & Sheppard, 2014). In the present study, the primary cells obtained from the healthy controls and the asthmatic patients were compared for the differential biomarkers.
The unique aspect of the current investigation is to detect severe asthma-specific biomarker in saliva samples collected from asthmatics and control subjects living in UAE. Globally, studies conducted to identify asthma biomarkers largely focused on sputum, blood, bronchial brushings, and urine samples (Vijverberg et al., 2013). The salivary biomarkers for asthma known so far are proteins detected by ELISA. There are no mRNA salivary biomarkers reported to date. Therefore, the current study attempted to develop non-invasive mRNA biomarkers from saliva for severe asthma using molecular tools and mathematical modeling.
2 Methodology #
Sample collection
Saliva from asthma patients and healthy controls were collected according to the previous protocol (Hachim et al., 2020). Ethical approval was granted for the present study under the reference number DSREC-11/2017_04 at the University of Sharjah. The samples were collected at Rashid Hospital, Dubai, UAE. The information about the patients and the parameters required for asthma regulation was recorded at the time of sample collection.
Cell culture
The primary cells obtained for the bronchial brushings of asthma patients and the healthy control subject were maintained at the tissue bank facility at Sharjah Institute of Medical Research (SIMR), College of Medicine, University of Sharjah. The specific culture medium required to maintain the cells was procured from Gibco, Thermo Fisher Scientific, US, and Sigma Aldrich, US. The primary human lung fibroblast cells for both healthy (NHLF) and asthmatic (DHLF) were obtained from Lonza, Switzerland. The smooth muscle cells and epithelial cells were obtained from the patient recruited in McGill University Health Centre/Meakins-Christie Laboratories Tissue Bank, Montreal, Canada.
RNA isolation and cDNA synthesis
RNA from saliva samples was isolated by Qiazol method as described in (Sullivan et al., 2020)Approximately, 500 ng of RNA was used to synthesize cDNA using high-capacity cDNA synthesis kit from Applied Biosystems.
RNA was isolated from cells using Trizol method and cDNA was synthesized as described above.
qRT PCR
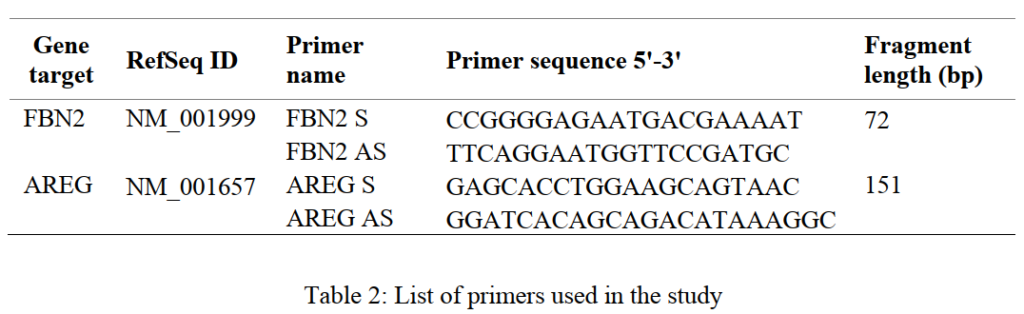
The quantitative real-time PCR (qPCR) was performed for the cDNA obtained from both the saliva samples and the cells using primers for amphiregulin (AREG) and fibrillin 2 (FBN2) as listed in Table 2. The analysis was conducted in Quant Studio® 3 qPCR machine from Applied Biosystems.
Mathematical modeling method to determine the optimal value of the cutoff
The Index of Union method was applied to the data to determine the optimal cutoff value for the specific genes across the different groups (Unal, 2017). The method provides an “optimal” cut-point with the best maximum sensitivity and specificity values simultaneously and can be summarized by the following equation:
IU (c) = (|Se (c) − AUC| + |Sp (c) − AUC|) (1)
IU = Index of Union
AUC = Area Under Curve
Se = Sensitivity
Sp = Specificity
(c) = cutoff
IU(c) = the optimal cutoff point based on the Index of Union
Statistical analysis
Data obtained from the quantitative real-time PCR were analyzed by using an in-house R script and the P value was obtained using Mann Whitney U test between the groups.
3 Results and Discussion #
Saliva sample collection and patient information
The whole saliva samples were collected from 10 healthy controls, 20 moderate asthma patients, and 18 severe asthmatics. The information regarding patient disease history and certain other characteristics was recorded using Salama Electronic Medical Record System launched by Dubai Health Authority (DHA).
From the records, patient history and characteristics were retrieved and were classified into moderate and severe asthma based on the FEV1 values, the number of asthma attacks, and hospitalization frequency (Table 1). Hence, it is important to maintain the clinical records with complete information and up to date.
Differential gene expression among the cell types
The major cell types known to involve in tissue remodeling are smooth muscle cells, epithelial cells, and fibroblasts. From the qPCR data, it is evident that AREG is highly expressed in asthmatic smooth muscle cells and epithelial cells. This data is consistent with the earlier known fact that AREG is upregulated in injured lung tissues and bronchial epithelial cells (Kuwano et al., 2017).
Similarly, FBN2 was upregulated in both the asthmatic smooth muscle cells and epithelial cells. Surprisingly, both genes showed no significant difference among the diseased fibroblast cells indicating their specific function in the preliminary tissue remodeling events.
Differential gene expression in saliva samples collected from the subgroups of asthma patients
Among the asthmatics, moderate/non-severe patients could be differentiated from the severe asthmatics based on the expression profile for AREG and FBN2 genes. Severe asthmatics showed higher expression for AREG and lower for FBN2 as compared to moderate asthmatics. Both genes showed a significantly higher expression in asthmatics than in healthy controls indicating that they can be used as asthma biomarkers. In addition, the differential pattern of expression among moderate and severe asthma can be exploited to differentiate the severity of the condition among the patient samples.
Determination of the cutoff value using the Index of Union mathematical method
Based on the Index of Union mathematical equations, an optimal cutoff value to differentiate severe from moderate asthmatics was deduced for both AREG and FBN2 genes in saliva. The fold change greater than 15 for FBN2 differentiates non-severe asthmatics from severe. And a fold change cut-off value 2 for AREG differentiates asthmatics from healthy controls. A combined profile for both AREG and FBN2 could be used to predict the severity of asthma among the patients.
4 Conclusion and future perspectives #
From the study, a cutoff value was determined for two salivary mRNA biomarkers amphiregulin and fibrillin 2 using a linear mathematical model and the information from patient records to assess the severity of asthma in a non-invasive approach. The expression profile from the cells involved in tissue remodeling validated the mRNA biomarkers considered in the study. In the future, a similar study on larger datasets and robust mathematical modeling tools could help deduce a functional cutoff value that can be used to differentiate and predict severe asthma samples from moderate asthmatics and prescribe personalized medication.
5 Funding #
This research has been financially supported by Sharjah Research Academy (Grant code: MED001); the University of Sharjah (Grant code: 1901090254).
Reference #
Agache, I., Strasser, D. S., Pierlot, G. M., Farine, H., Izuhara, K., & Akdis, C. A. (2018). Monitoring inflammatory heterogeneity with multiple biomarkers for multidimensional endotyping of asthma. Journal of Allergy and Clinical Immunology, 141(1), 442–445. https://doi.org/10.1016/j.jaci.2017.08.027
Altman, M., & Busse, W. W. (2017). A Deep Dive into Asthma Transcriptomics. American Journal of Respiratory and Critical Care Medicine, 195, 1279–1280.
Enomoto, Y., Orihara, K., Takamasu, T., Matsuda, A., Gon, Y., Saito, H., Ra, C., & Okayama, Y. (2009). Tissue remodeling induced by hypersecreted epidermal growth factor and amphiregulin in the airway after an acute asthma attack. Journal of Allergy and Clinical Immunology, 124(5), 913-920.e7. https://doi.org/10.1016/j.jaci.2009.08.044
Erle, D. J., & Sheppard, D. (2014). The cell biology of asthma. Journal of Cell Biology, 205(5), 621–631. https://doi.org/10.1083/jcb.201401050
Hachim, M. Y., Elemam, N. M., Ramakrishnan, R. K., Hachim, I. Y., Salameh, L., Mahboub, B., al Heialy, S., Halwani, R., Hamoudi, R., & Hamid, Q. (2020). Confounding patient factors affecting the proper interpretation of the periostin level as a biomarker in asthma development. Journal of Asthma and Allergy, 13, 23–37. https://doi.org/10.2147/JAA.S230892
Hachim, M. Y., Mahboub, B., Hamid, Q., & Hamoudi, R. (2019). Identifying Asthma genetic signature patterns by mining Gene Expression BIG Datasets using Image Filtering Algorithms. IST 2019 – IEEE International Conference on Imaging Systems and Techniques, Proceedings, 1–6. https://doi.org/10.1109/IST48021.2019.9010412
Hachim MY, Elemam NM, Ramakrishnan R , Salameh L , Olivenstein R, Hachim I , Venkatachalam T, Mahboub B, Heialy S , Halwani R, H. Q. and H. R. (2020). Blood and Salivary Amphiregulin levels as biomarkers for Asthma. Frontiers Medicine, 10.3389/fm.
Kuwano, K., Yanagihara, T., Hamada, N., Ikeda-Harada, C., Yokoyama, T., Suzuki, K., Kawaguchi, T., Maeyama, T., & Nakanishi, Y. (2017). Amphiregulin suppresses epithelial cell apoptosis in lipopolysaccharide-induced lung injury in mice. Biochemical and Biophysical Research Communications, 484(2), 422–428. https://doi.org/10.1016/j.bbrc.2017.01.142
Mahboub, B. H., Al-Hammadi, S., Rafique, M., Sulaiman, N., Pawankar, R., al Redha, A. I., & Mehta, A. C. (2012). Population prevalence of asthma and its determinants based on European Community Respiratory Health Survey in the United Arab Emirates. BMC Pulmonary Medicine, 12. https://doi.org/10.1186/1471-2466-12-4
Mahboub, B. H. S. H., Santhakumar, S., Soriano, J. B., & Pawankar, R. (2010). Asthma insights and reality in the United Arab Emirates. Annals of Thoracic Medicine, 5(4). https://doi.org/10.4103/1817-1737.69109
Richards, L. B., Neerincx, A. H., van Bragt, J. J. M. H., Sterk, P. J., Bel, E. H. D., & Maitland-Van der Zee, A. H. (2018). Biomarkers and asthma management: Analysis and potential applications. Current Opinion in Allergy and Clinical Immunology, 18(2), 96–108. https://doi.org/10.1097/ACI.0000000000000426
Silkoff, P. E., Laviolette, M., Singh, D., FitzGerald, J. M., Kelsen, S., Backer, V., Porsbjerg, C. M., Girodet, P.-O., Berger, P., Kline, J. N., Chupp, G., Susulic, V. S., Barnathan, E. S., Baribaud, F., & Loza, M. J. (2017). Identification of airway mucosal type 2 inflammation by using clinical biomarkers in asthmatic patients. The Journal of Allergy and Clinical Immunology, 140(3), 710–719. https://doi.org/10.1016/j.jaci.2016.11.038
Sullivan, R., Heavey, S., Graham, D. G., Wellman, R., Khan, S., Thrumurthy, S., Simpson, B. S., Baker, T., Jevons, S., Ariza, J., Eneh, V., Pye, H., Luxton, H., Hamoudi, R., Whitaker, H., & Lovat, L. B. (2020). An optimised saliva collection method to produce high-yield, high-quality RNA for translational research. PLoS ONE, 15(3), 1–16. https://doi.org/10.1371/journal.pone.0229791
Tang, H. H. F., Sly, P. D., Holt, P. G., Holt, K. E., & Inouye, M. (2020). Systems biology and big data in asthma and allergy: Recent discoveries and emerging challenges. European Respiratory Journal, 55(1). https://doi.org/10.1183/13993003.00844-2019
Tiotiu, A. (2018). Biomarkers in asthma: state of the art. Asthma Research and Practice, 4(1), 1–10. https://doi.org/10.1186/s40733-018-0047-4
Unal, I. (2017). Defining an optimal cut-point value in ROC analysis: An alternative approach. Computational and Mathematical Methods in Medicine, 2017. https://doi.org/10.1155/2017/3762651
Vijverberg, S. J. H., Hilvering, B., Raaijmakers, J. A. M., Lammers, J. W. J., Maitland-van der Zee, A. H., & Koenderman,L. (2013). Clinical utility of asthma biomarkers: From bench to bedside. Biologics: Targets and Therapy, 7(1), 199–210. https://doi.org/10.2147/BTT.S29976
Wenzel, S. E. (2012). Asthma phenotypes: The evolution from clinical to molecular approaches. Nature Medicine, 18(5), 716–725. https://doi.org/10.1038/nm.2678
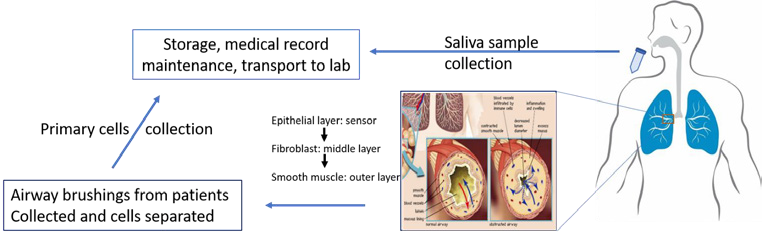
Figure 1: A schematic for the sample collection and record maintenance from patients with asthma
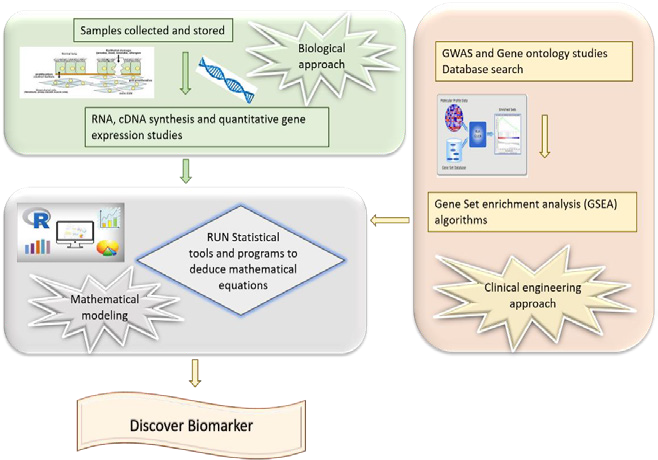
Figure 2: A schematic for the strategy applied in the current study to identify saliva biomarkers for severe asthma
A

B
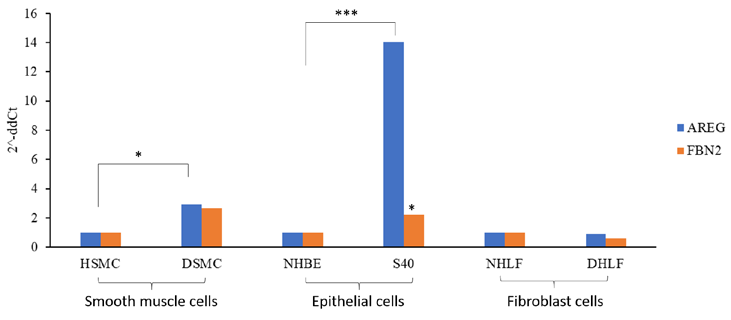
Figure 3: Differential gene expression for AREG and FBN2 among patient saliva samples (A) and asthmatic cells (B)
HSMC-Normal Smooth Muscle cells; DSMC- Asthmatic Smooth Muscle cells; NHBE- Normal Human Bronchial epithelial cells; S40- severe asthmatic epithelial cells from bronchial brushings; NHLF- normal Human Lung Fibroblasts; DHLF- Asthmatic fibroblast cells
| Name of the parameter | Moderate asthma | Severe asthma |
| Number of Samples | 20 | 18 |
| Number of males | 4 | 8 |
| Number of females | 16 | 10 |
| Average age | 47 | 44.5 |
| Smoking | None | Four |
| FEV1 average (%) | 75.8 | 81.3 |
| Blood eosinophil average(N* 10^3/uL) | 0.27 | 0.56 |
| Exacerbations (Avg) | 0.5 | 1.78 |
| Ig E levels (average) | 436 | 534 |
| Allergy (number) | 5 | 7 |
Table 1: List for the data for the patients from Electronic Medical Records