Mohamed Hussein*, Mariam Wafik*
Pavement Engineers in Namaa Consult, Egypt
mhussein@namaaconsult.com
mariam.m@namaaconsult.com
Abstract #
Aligned with the “Future of AI Technologies in Maintenance Training & Education,” our paper illustrates the methodology needed to bridge the gap between technological advancements and effective training and education in pavement infrastructure maintenance, by developing a maintenance decision tool through the seamless integration of asset management systems (AMS) with digital twin technology (DT). This approach empowers decision-makers with accurate and efficient maintenance planning capabilities. In summary, our goals intricately intertwine with the future of Artificial Intelligence (AI) technologies in maintenance training and education, highlighting the need for upskilling and integrating technology-driven methodologies into the educational landscape.
The efficient management of pavement infrastructure is crucial for ensuring safe and sustainable transportation networks. In this context, the integration of cutting-edge technologies holds immense potential to redefine maintenance practices. This paper delves into the integration of Digital Twin technology with Asset Management Systems (AMS) as a pioneering approach to optimize pavement infrastructure maintenance.
Digital Twin technology, acting as a virtual replica of physical assets, has revolutionized the way infrastructure is monitored and managed [1]. Complementing this, Asset Management System (AMS) is a systematic process of maintaining, upgrading and operating assets, combining engineering principles with sound business practice and economic rationale, and providing tools to facilitate a more organized and flexible approach to making the decisions necessary to achieve the public’s expectations providing a systematic framework for effective asset maintenance [2]. This paper outlines merging of these two systems, yielding a methodology for developing a maintenance decision tool through the seamless integration of pavement management systems with digital twin technology. This approach empowers decision-makers with accurate and efficient maintenance planning capabilities
Through a real case study conducted on a significant road segment in Jeddah Municipality, Saudi Arabia, the paper showcases the possible benefits of this integration. The case study explores data acquisition, manipulation, and modeling processes. The integration further facilitates advanced analytics, and maintenance decision planning. As the transportation industry seeks innovative solutions to enhance infrastructure sustainability, the integration of DT technology and AMS emerges as a promising avenue.
Keywords: Asset Management System AMS, Digital Twin DT, Maintenance Training and Education.
1. Introduction #
In the realm of infrastructure maintenance, the integration of advanced technologies has become crucial to optimize efficiency, resource allocation, and decision-making processes. Among these technologies, digital twin technology has emerged as a transformative tool with immense potential to revolutionize pavement management systems.
Digital twin technology serves as a bridge between the virtual and real worlds. By leveraging real-time data collected from physical sites, we can create virtual replicas of our infrastructure and enhance our understanding of its current state. In today’s digital era, we have the capability to digitize every component of our network, allowing us to develop a comprehensive Asset Management System (AMS). This integrated system ensures the safety, sustainability, and optimal performance of our road networks by enabling real-time monitoring, data analysis, and informed decision-making.
Traditional methods of pavement management are plagued by several weaknesses, including data gaps, escalating costs, and lengthy data collection and analysis processes. However, the integration of AMS and digital twin technology addresses these challenges and offers numerous advantages. By consolidating both systems into a single application or platform, stakeholders gain a deeper understanding of the infrastructure’s current condition. Decision-makers and asset owners can visually assess the infrastructure, simulate various scenarios, and evaluate the potential impact of interventions. This fosters data-driven discussions, enabling them to make well-informed decisions and enhance the efficiency, effectiveness, and sustainability of infrastructure management.
Furthermore, the integration of digital twins with pavement management systems facilitates advanced analytics and predictive modeling. Machine learning algorithms have the ability to analyze vast amounts of data, detect patterns, and forecast deterioration trends. This empowers stakeholders to develop optimized maintenance strategies and allocate resources more effectively. By adopting proactive maintenance practices instead of reactive approaches, asset owners can minimize downtime, extend the lifespan of assets, and ultimately reduce overall lifecycle costs.
In conclusion, the integration of digital twin technology with pavement management systems represents a significant advancement in infrastructure maintenance. This integration empowers stakeholders to gain real-time insights, simulate scenarios, and make data-driven decisions. By harnessing the power of digital twins and advanced analytics, asset owners can optimize resource allocation, improve infrastructure performance, and achieve long-term sustainability. In the following sections, we will delve deeper into the technical considerations, benefits, challenges, and practical methodology model of integrating digital twins with pavement management systems.
2. Background and Related Work #
The concept of Digital Twin (DT) has evolved significantly since its introduction in 2002 by Grieves. It has transformed from a basic virtual replica of real-world objects to a fundamental component of decision support systems. Recent research by Fuller et al. (2023) [3] highlights the integration of physical and virtual elements in various domains such as manufacturing, healthcare, and smart cities, offering opportunities for innovation and optimization. However, there are ongoing challenges and research gaps to explore, indicating the potential of Digital Twins to revolutionize decision support systems across industries.
In the context of pavement management systems, Mehran (2022) [4] emphasizes the combination of physics-based models and data-driven machine learning techniques for predicting road deterioration. This approach leverages physics-based models to simulate the physical processes associated with road degradation, while machine learning algorithms analyze historical data to uncover patterns and trends. The integration of these approaches enhances the accuracy and robustness of road deterioration prediction, leading to improved decision-making in pavement maintenance strategies.
Furthermore, Consilvio et al. (2023) [5] presents a methodology for creating a maintenance decision tool by integrating pavement management systems with digital twin technology. This integrated approach aims to empower decision-makers with a powerful tool for accurate maintenance decision-making processes. By leveraging the insights and data analytics provided by digital twins, real-time monitoring, asset condition analysis, and predictive modeling can optimize resource allocation, reduce costs, and prolong the lifespan of road infrastructure.
2.1 Real Case Study
Real-life case study in Australia demonstrates the benefits of integrating digital twin technology with pavement management systems. [6]. Using advanced modeling and machine learning from Unmanned Aerial Vehicle (UAV) data, the study developed a cognitive twin capable of detecting pavement distress. Compared to manual survey and laser detection, the digital twin approach showed improved efficiency, cost savings, and better infrastructure management.
2.1.1 Study area
Turner Street in Port Melbourne, Victoria, as shown in figure 1 [6] , was selected for the case study. The 1.2 km road is situated in a transited industrial area, experiencing continuous damage and requiring ongoing maintenance. A cognitive digital twin was developed for the pavement, accurately depicting its current condition and detecting distresses like cracking and rutting. The road’s high traffic and maintenance challenges made it an ideal test bed for continuous UAV surveillance proof of concept.
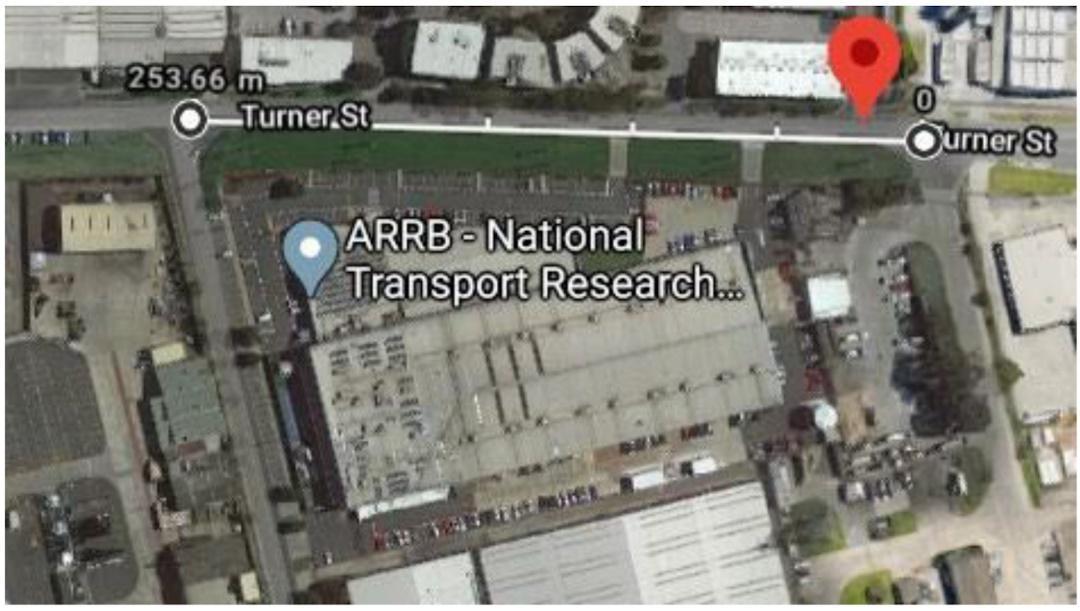
Figure 1: Turner Street drone capture area.
2.1.2 Methodology
The methodology used in the case study involved three key steps:
Data Acquisition: Two Phantom 4 RTK drones with a D-RTK 2 base station were used to collect photographic data of Turner Street. The drones employed an embedded RTK system for precise coordinates. Manual still image flight approach was selected as the optimal method for recreating the road, capturing 205 images over 250 meters in 10 minutes.
Twin Model Development: The acquired images were processed to create a complete reality model figure 2 [6] within 2 hours. The reality model accurately represented the road’s current condition, including various distresses such as rutting, potholes, and crocodile cracking and this can be seen in figure 3 [6].

Figure 2: Turner Street reality model developed through photogrammetry.
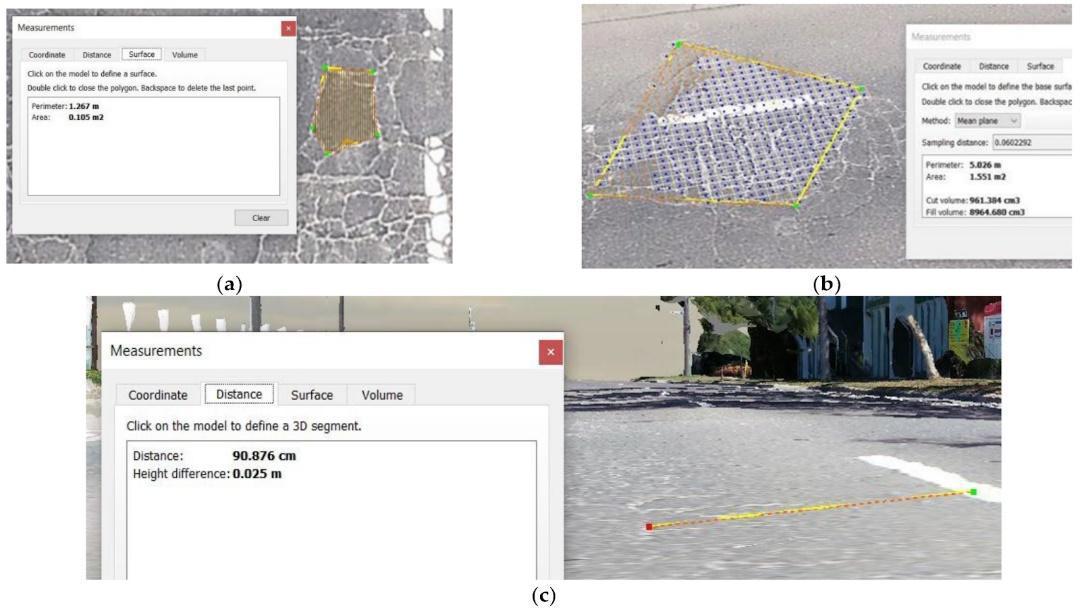
Figure 3: Distresses from the reality model: (a) crocodile cracking; (b) pothole; and (c) rutting.
2.1.3 Cognitive Twin Architecture
Transfer learning technology and VGG16 CNN models were utilized as feature extractors for the ML-based classifier. The network was trained on RGB crack images of pavement, achieving reliable distress detection with a failure rate of less than 20%. The trained model successfully detected cracks in test images. Figure 4 [6] represents a prediction of cracks from a test image.

Figure 4: Predicting the cracks from the trained model using a new image.
Overall, the methodology involved data acquisition through RTK-enabled drones, reality model development through photogrammetry, and cognitive twin architecture employing transfer learning for distress detection. The results showcased the effectiveness of integrating digital twin technology with pavement management systems for accurate monitoring and decision-making.
2.1.4 Cost and Time Analysis
The cost and time analysis compared three methods for pavement assessment: traditional manual survey, advanced vehicle data capture, and the proposed digital twin method, which is illustrated in table 1 and figure 5 [6].
| Method | Cost (in units) | Labor Requirement | Output | Time (in hours) |
| Traditional Manual Survey | Moderate | Two individuals | Conventional Report | Similar to others |
| Advanced Vehicle Data | High | Two individuals | Detailed Data Capture | 2.1 hours |
| Proposed Digital Twin | Cost-Effective | One individual | Digital Twin Model | Similar to others |
Table 1: Comparison Between Three Pavement Assessment Methods.
Please note that the “Cost” column represents a qualitative comparison (e.g., High, Moderate, Cost-Effective) rather than specific numerical values. The time is indicated as “Similar to others” since the time taken by all three methods was comparable, with the advanced vehicle method being slightly faster
3. Smart Maintenance Decision Tool Methodology #
The methodology for developing the smart maintenance decision tool involves four essential layers, culminating in the creation of a comprehensive model that integrates digital twin and AMS technologies. This model follows a systematic process, as depicted in Figure 6.
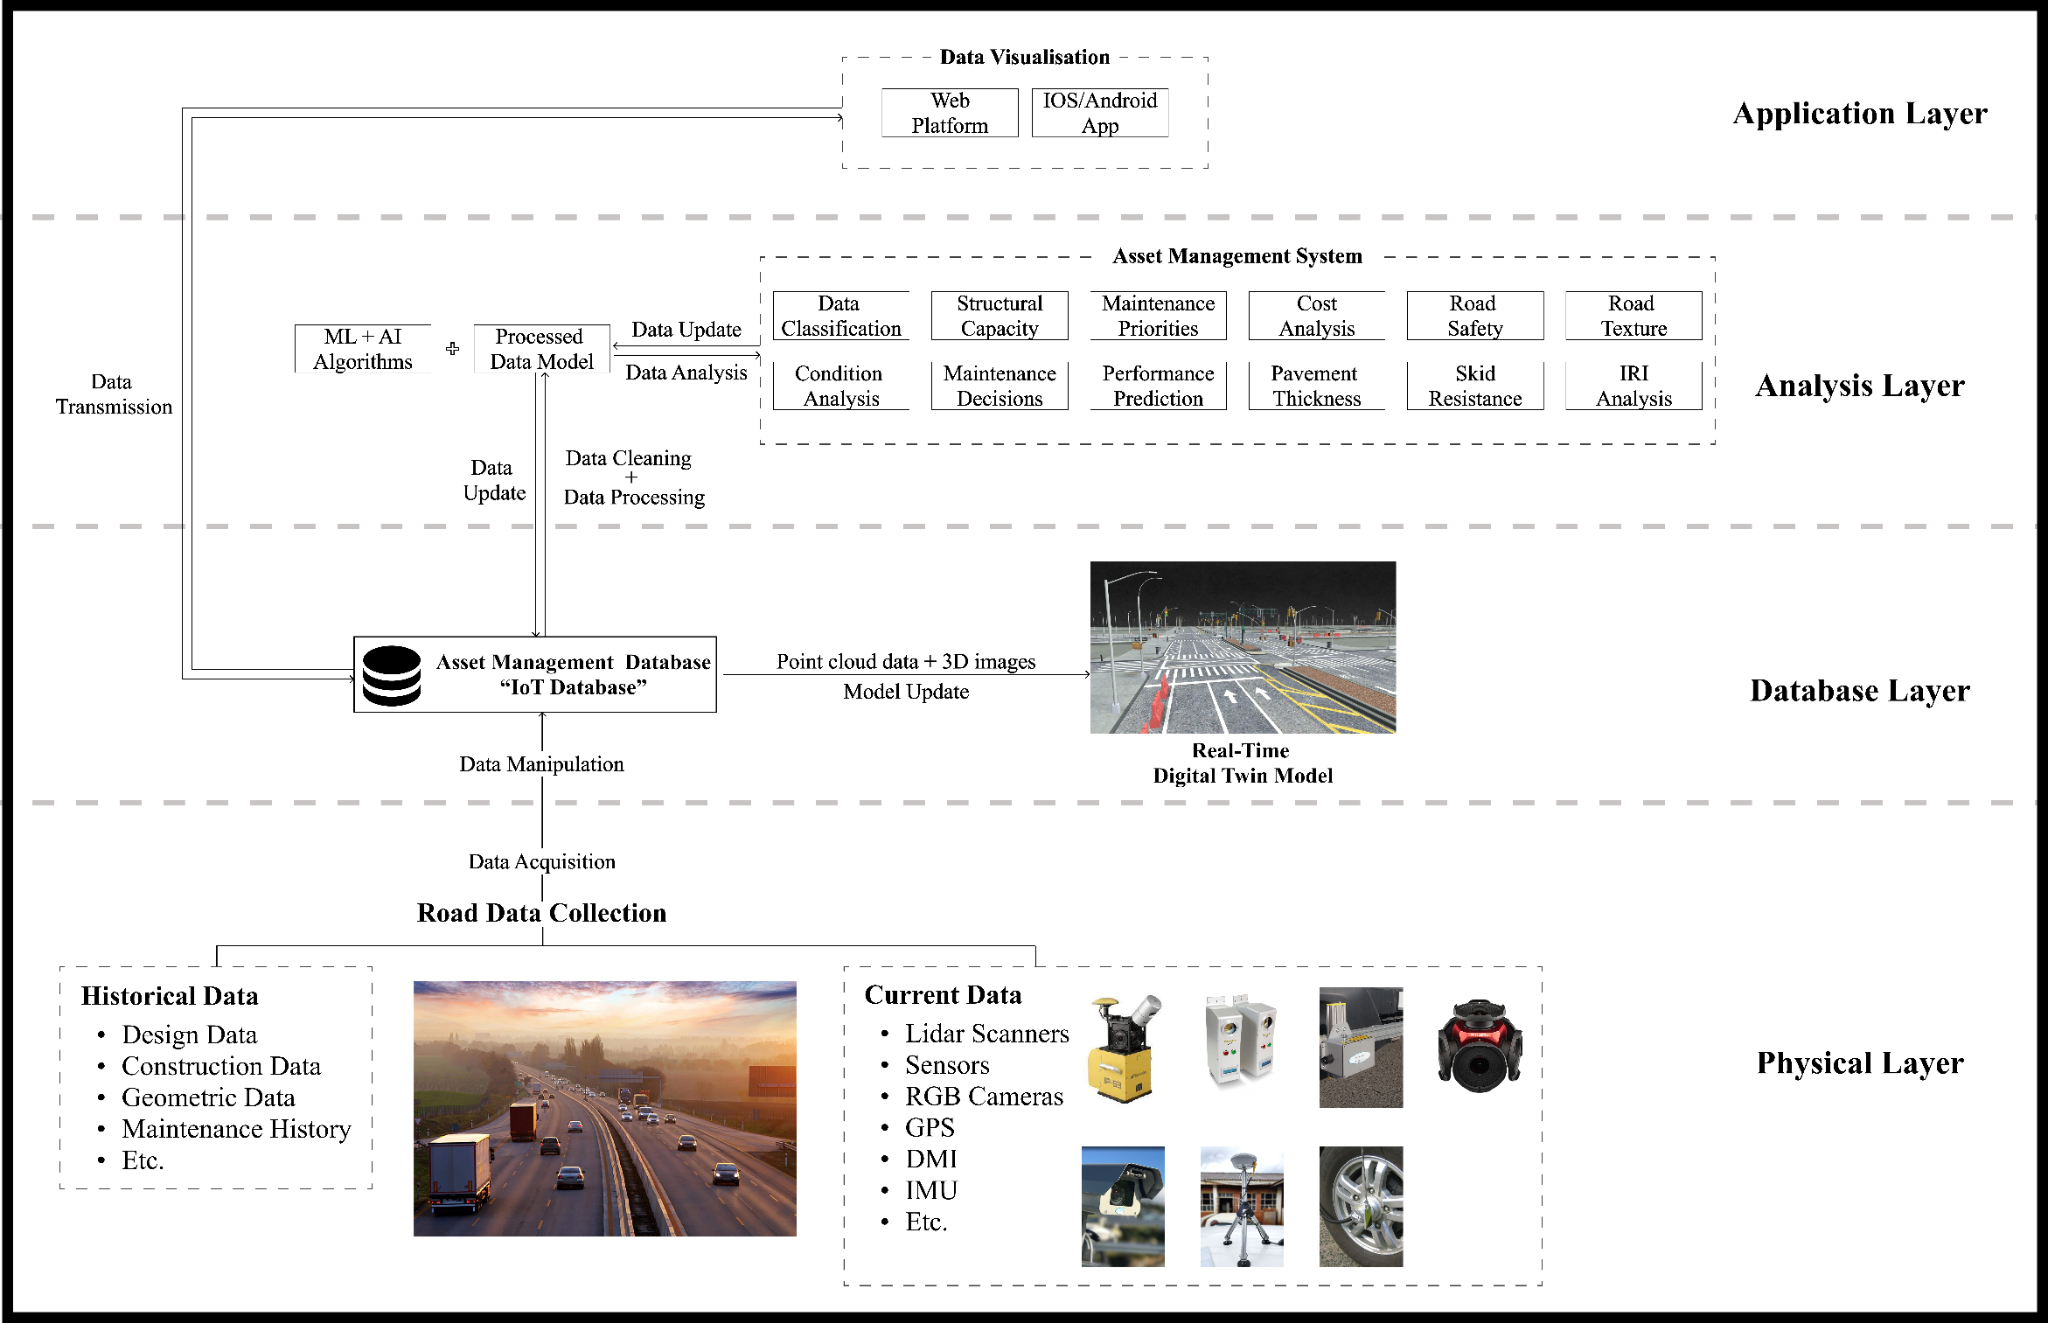
Figure 5: Cost and time comparison for 1 km of pavement.
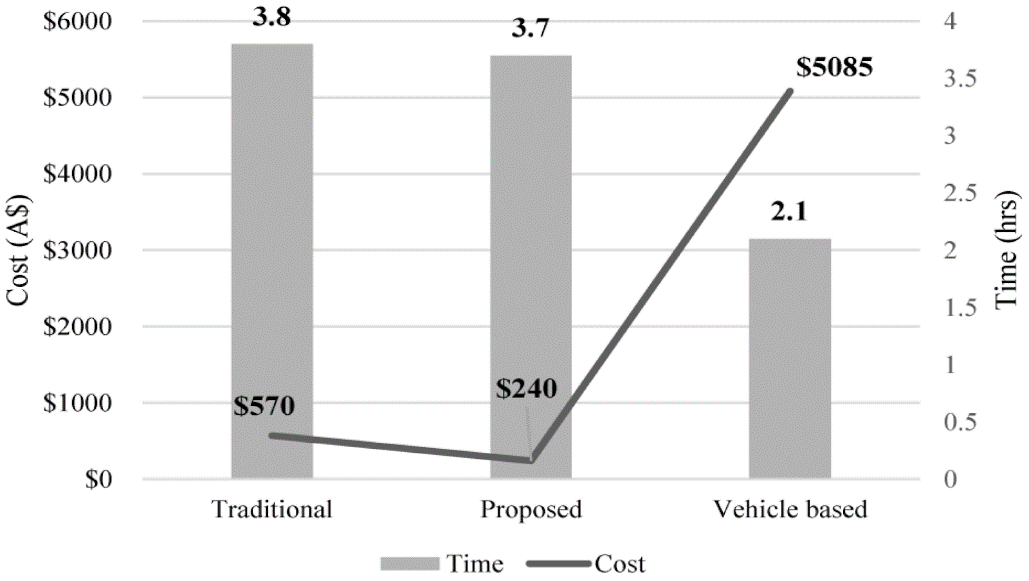
Figure 6: AMS and DT integration methodology layers.
The initial layer, known as the Physical layer, focuses on the data collection process. This layer aims to collect data “historical and current” throughout the lifecycle of the road, from design and construction to operation and maintenance. Handling a vast amount of data presents a significant challenge, which includes gathering information from various equipment and sensors. Incorporating the concept of the Internet of Things (IoT), each vehicle in the network is equipped with a data acquisition system that ensures real-time data collection from all its sensors. This allows for the retrieval of valuable and usable data in real-time from every vehicle in the network. Subsequently, data acquisition and manipulation are conducted to convert the raw data into usable format data for the subsequent layers of processing, analysis, visualization, and modeling.
The second layer, referred to as the Asset Management Database layer, is an IoT cloud database. This database stores all the data gathered during the initial layer in real-time. In this layer, point cloud data and 3D images are utilized to generate real-time digital twin models of the road being studied. This enables a dynamic representation of the road’s characteristics. The reason for using an IoT database was mainly due to 2 reasons: real-time data collection, where IoT devices can gather and transmit data continuously, allowing for up-to-date information on various parameters. And remote monitoring and control, where IoT enables remote monitoring and control of devices and systems, providing convenience and efficiency in managing assets.
In the data analysis layer, data cleaning and processing take place. Advanced Artificial Intelligence (AI) and Machine Learning (ML) computer vision algorithms are deployed for automated classification and analysis of both current and historical data. For instance, the point cloud data allows for automatic classification of objects like light poles, traffic signs, or traffic poles, along with determining their condition. Additionally, using deep learning and convolutional neural networks (CNN), a model is created to accurately identify pavement distress and asset conditions, providing efficient and timely assessments of the network’s assets. The analyzed data are updated in the Asset management Database, consequently updating the digital twin model. This step enhances the accuracy and efficiency of the decision-making process. Within the AMS system, comprehensive analyses are conducted, such as calculating the Pavement Condition Index (PCI) and International Roughness Index (IRI) for each asset. Additionally, the maintenance decision-making process is facilitated, taking into account the behavior of each element and distress. Utilizing AI algorithms, prediction models for each distress are generated, enabling prioritization and envisioning the future status of the network with both a conceptual and digital representation. This integration between AMS and Digital Twin technology amplifies the maintenance decision tool’s potential.
Finally, the application layer involves the development of a web-platform tool accessible to maintenance decision-makers. This powerful application can also be accessed via IOS or Android apps, providing a user-friendly and efficient platform for making informed maintenance decisions. The application is used as a data visualization and modeling layer, employing various visualization tools such as dashboards, GIS, point cloud, and image viewers to present a comprehensive view of the analyzed data. Leveraging Geographic Information System (GIS) proves highly beneficial in visualizing the analyzed data on a map, complete with data attributes. Utilizing ESRI dashboards allows for comprehensive data analysis, facilitating the decision-making process. By incorporating high-quality images, classified point cloud data, and mapped pavement distress and thickness, a comprehensive visualization of assets is achieved, empowering decision-makers to make informed choices. Moreover, for 3D modeling, platforms like Unreal Engine can be employed, ensuring user-friendly access on both PCs and mobile devices.
4. Case Study #
4.1 Study Area
For our case study, our focus centers on a significant road segment situated within Al-Mohamadya region of Jeddah Municipality, Saudi Arabia. Awes Ebn Thabet Road (under Jeddah Municipality authority), shown in figure 7, plays a pivotal role in connecting Prince Sultan Rd and Al-Madinah Al-Monawra Rd. Spanning almost 1 km, this road comprises a flexible asphalt pavement with three lanes in each direction, each of which is 3.2 meters wide. Our investigation will concentrate on the left lane in the direction from Prince Sultan Rd to Al-Madinah Al-Monawra Rd, which is divided into two sections (Section_1 & Section_2) with 270m and 440m respectively. This specific segment has been chosen as a representative specimen to outline the broader characteristics of the entire road.
The selection of this particular road stems from its evident traffic-related challenges and the less-than-optimal state of its pavement, as shown in figure 8. This prompted us to subject the road to thorough testing using our specialized equipment.
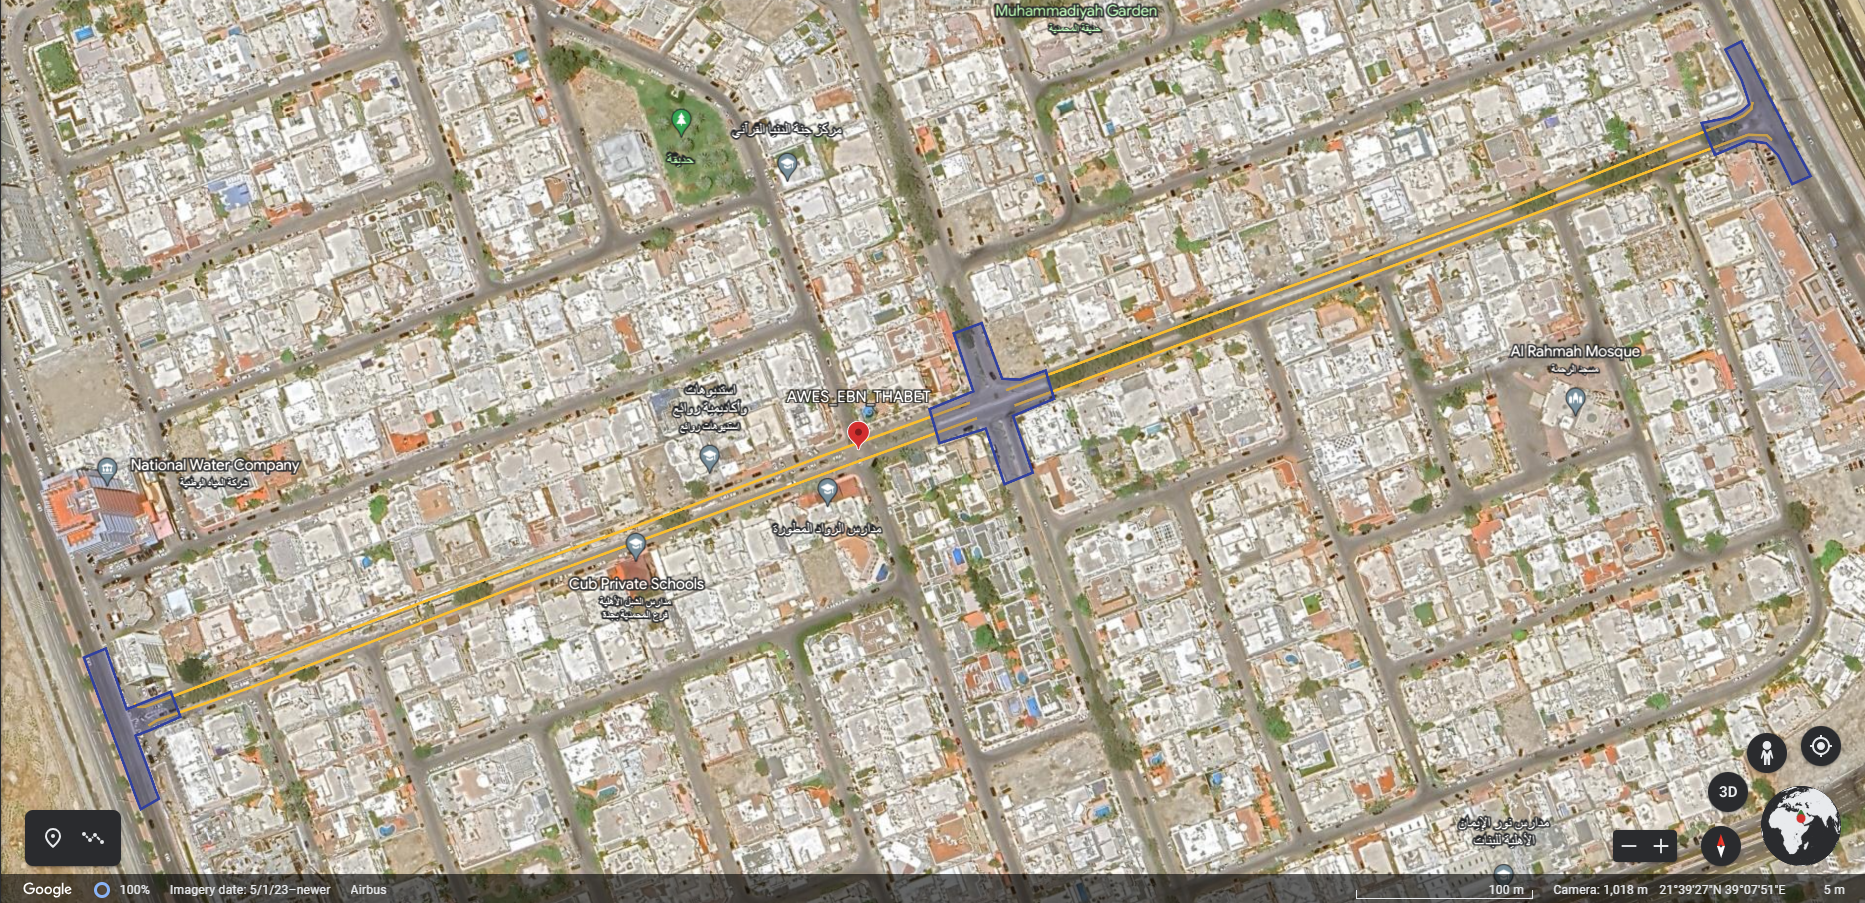
Figure 7: Awes Ebn Thabet Road

Figure 8: Awes Ebn Thabet road condition; (a) Rutting along with raveling, (b) Poor patch around manhole, (c) Depression in manhole “acts as a pothole”, (d) clear severe weathering and raveling distresse, (e) bleeding.
The central aim of this case study revolves around the comprehensive collection and analysis of all accessible data from the physical layer. This encompasses data acquired through diverse sensors and vehicle-mounted equipment. These collected data will then traverse several pivotal stages, commencing with rigorous data analysis, processing, and subsequent modeling. The ultimate objective is to illustrate the possible benefits of developing a detailed and exhaustive digital twin of the selected road based on the methodology of integration between AMS and DT described in figure 6.
4.2 Physical Layer Equipment
In the detailed exploration of the physical layer, we find a network of interconnected vehicles, each equipped with advanced sensors, software, and technologies to collect and exchange crucial data, facilitating the creation of our digital twin model.
At the forefront is the mobile mapping system (Topcon IP-S3 [7]) mounted on a vehicle shown in figure 9, featuring a powerful rotating LIDAR sensor capturing the surrounding environment at a rate of 700,000 pulses per second. With 32 internal lasers covering the full 360 degrees around the system from slightly different viewing angles during each rotation, it minimizes gaps in the point cloud caused by obstacles or blind spots, eliminating the need for multiple scanners. Equipped with a six-lens digital camera system, the IP-S3 captures 360-degree, high-resolution spherical images that facilitate easy recognition of features. The IP-S3 positioning system incorporates an Inertial Measurement Unit (IMU), a GNSS receiver (GPS and GLONASS), and a vehicle odometer. It delivers precise positioning and attitude information in dynamic environments. This mobile mapping system combines high-density, high-precision point clouds and high-resolution panoramas in a smaller and lighter package, making it easier to handle.
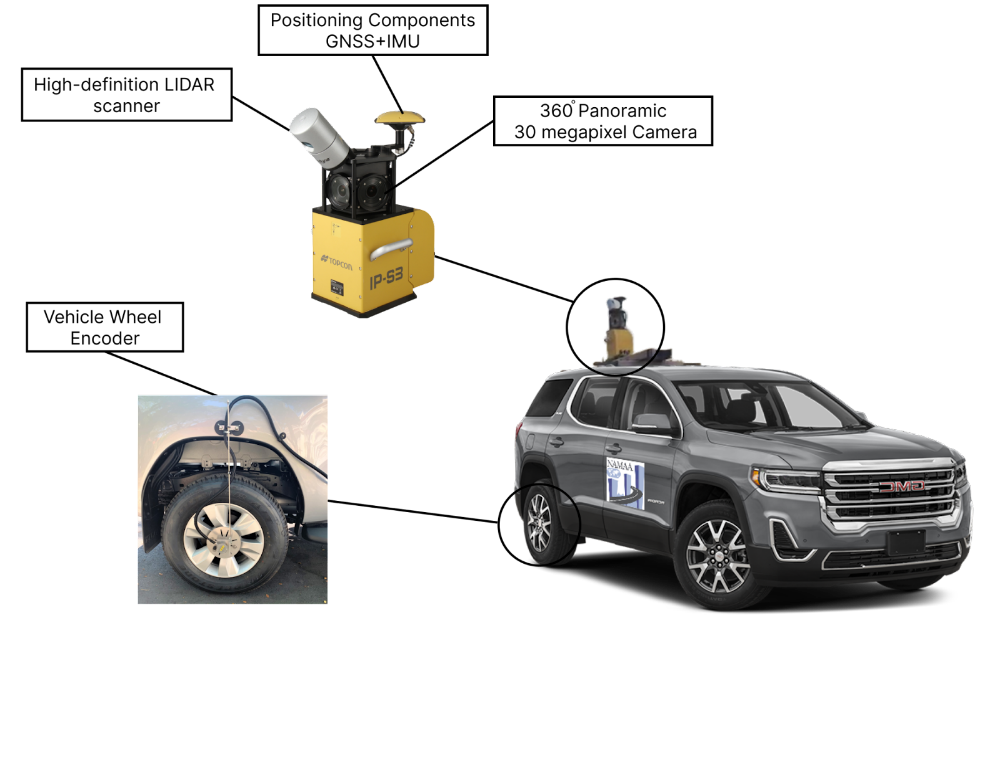
Figure 9: Mobile Mapping System Components.
Pavement data is collected using the Multi-Function Vehicle (MFV) shown in figure 10. The MFV is equipped with two high-precision laser units (LCMS-2) from Pavemetrics [8], capturing the pavement surface at a 28,000 Hertz scanning frequency, effectively detecting pavement distresses and cracks at a remarkable 1 mm resolution and at speeds up to 100 km/h. The MFV is fitted with a laser profilometer beam at the front bumper, capturing the pavement surface roughness (measured as International Roughness Index IRI) and texture data at a remarkable 0.05 mm vertical resolution for IRI measurements every 25mm interval (confidence level of 95%). Additionally, the MFV is over-fitted with a 360-degree camera covering the road right of way (ROW) for quality control of the processed data. The vehicle is also equipped with GNSS, IMU, and wheel odometer to establish the location of the vehicle or road center line at any given time. The geo-referenced data allows for easy integration with GIS mapping or asset management software.
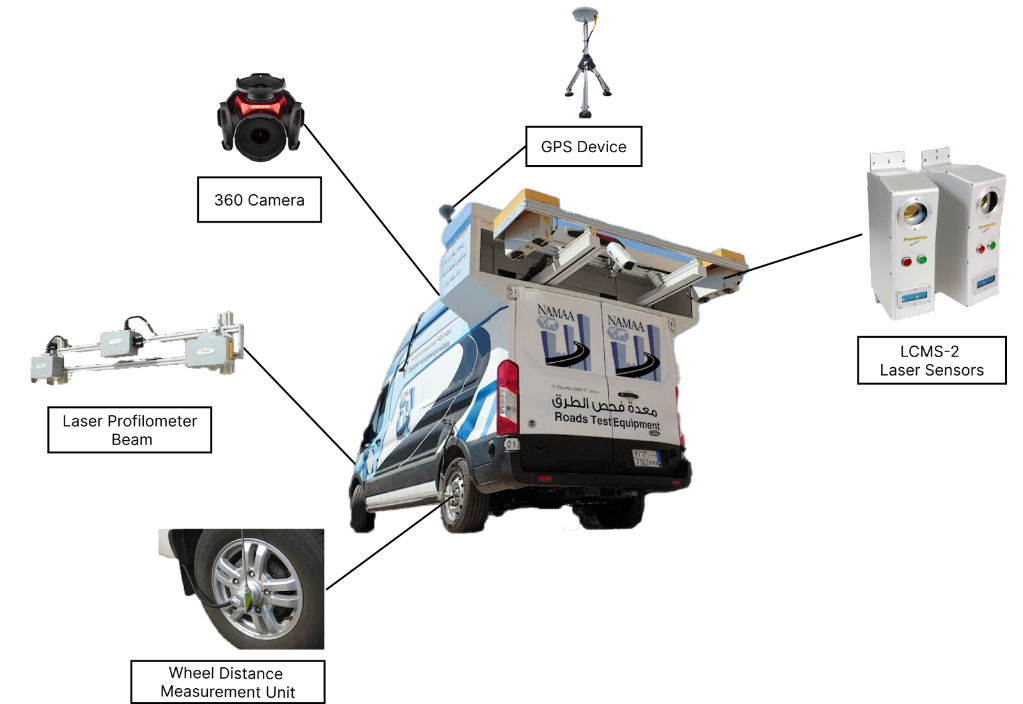
Figure 10: Multi-Function Vehicle Components.
To ensure precise maintenance decisions, Non-Destructive Tests (NDT) are conducted to collect structural capacity, pavement layer thickness, and skid resistance data. The Fast-Falling Weight Deflectometer (Fast-FWD), the Ground Penetration Radar (GPR), and the Pavement Friction Tester (PFT) are essential for this purpose.
The Fast-Falling Weight Deflectometer (Dynatest Fast-FWD [9]), shown in Figure 11, is a non-destructive and fast method to evaluate the structural capacity of pavements for research, design, rehabilitation of the road and for pavement management purposes. The Fast-FWD applies a dynamic load (ranging from (7-120 kN) up to 150 kN) that simulates the loading of a moving wheel, where the falling weight drops on a load cell mounted on top of a loading plate. The pavement surface vertical movement or deflection is recorded with 7-15 deflection sensors. The Fast-FWD is integrated with accelerometers measuring the acceleration of the falling weight during impact, aiding in analyzing pavement deflection. The data collected is georeferenced using GPS. The pavement response is analyzed with Dynastes’s ELMOD (Evaluation of Layer Moduli and Overlay Design) software to determine the elastic moduli, stresses, and strains of each modeled layer. ELMOD reports the weakest layer of failure, residual life and determines the optimum rehabilitation alternatives.

Figure 11: Dynatest Fast- Falling Weight Deflectometer Components.
The Ground Penetration Radar (GSSI-GPR [10]), shown in figure12, is equipped with an antenna transmitting and receiving electromagnetic waves into the ground at frequencies ranging from 1 to 2 GHz. The electromagnetic pulses sent into the subsurface can reach a maximum depth of 60 cm. The reflected signals captured by the receiver provide valuable subsurface data, in the form of pavement layer thicknesses. GPS is again utilized for georeferencing. The GPR assists in determining the thickness of each pavement layer, allowing for accurate structural capacity assessment using the ELMOD software.
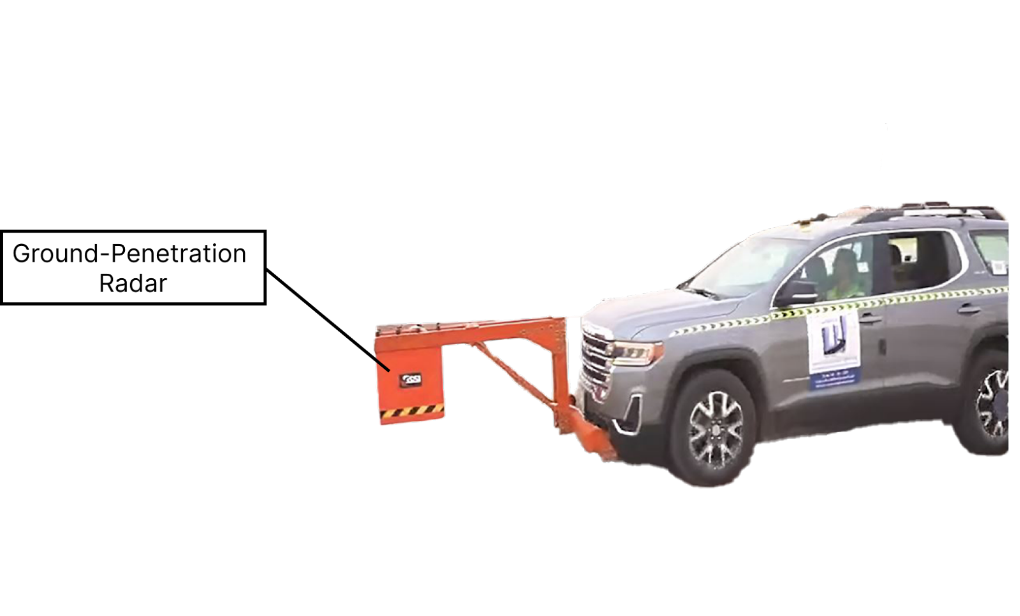
Figure 12: GSSI Ground Penetration Radar Components.
Lastly, the Pavement Friction Tester (Dynatest PFT [11]), shown in figure 13, is designed for maintenance testing to evaluate changes or deterioration in pavement friction due to traffic, weathering, polishing, and/or aging. The Dynatest Pavement Friction Tester (PFT) measures the average locked wheel (skid) and peak (slip) friction characteristics on dry or self-wetted paved surfaces. The PFT contains a water tank, standard tire, and sensor, playing a crucial role in determining the friction number of the pavement surface. This information is vital for evaluating road safety and optimizing maintenance strategies.

Figure 13: Dynatest Pavement Friction Tester Components.
4.3 Data Collection and Processing
In each equipment unit, an integrated data collection system operates in tandem with a customized computer setup, exclusively dedicated to the acquisition of compiled data. Subsequently, the collected data undergoes a sequence of manipulation, processing, and in-depth analysis. This section provides a glimpse into the diverse data categories derived from the physical layer.
The data acquired through the Multi-Function Vehicle (MFV) is meticulously transformed into (.fis) files. These files include processed images and XML files, encompassing geographically referenced distress data, illustrated in figure 14.
Housing Ground Penetration Radar (GPR) data, a compilation of (.nat) files has been meticulously gathered. This resource has enabled the determination of pavement layer thickness for the road, as portrayed in figure 15. In addition, pivotal pavement data has been procured through Fast-Falling Weight Deflectometer (Fast-FWD) and Skid Resistance tests.
Subsequent to data collection via the mobile mapping vehicle, the gathered information is structured into (.las) files. The ensuing point cloud data can be subject to processing, ultimately enabling the creation of a dynamic 3D model, as depicted in figure 16.
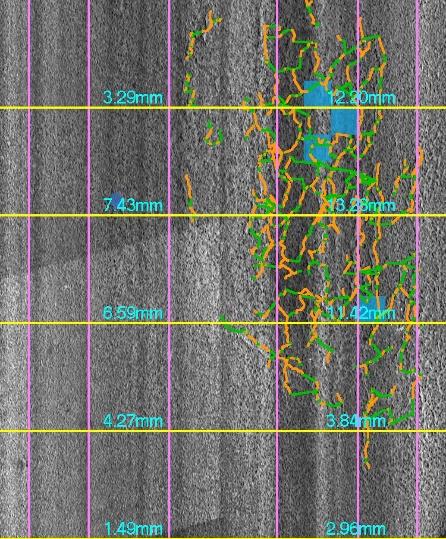
Figure 14: Distress Data Extracted from MFV |

Figure 15: Pavement Layer Depths Determined by GPR |
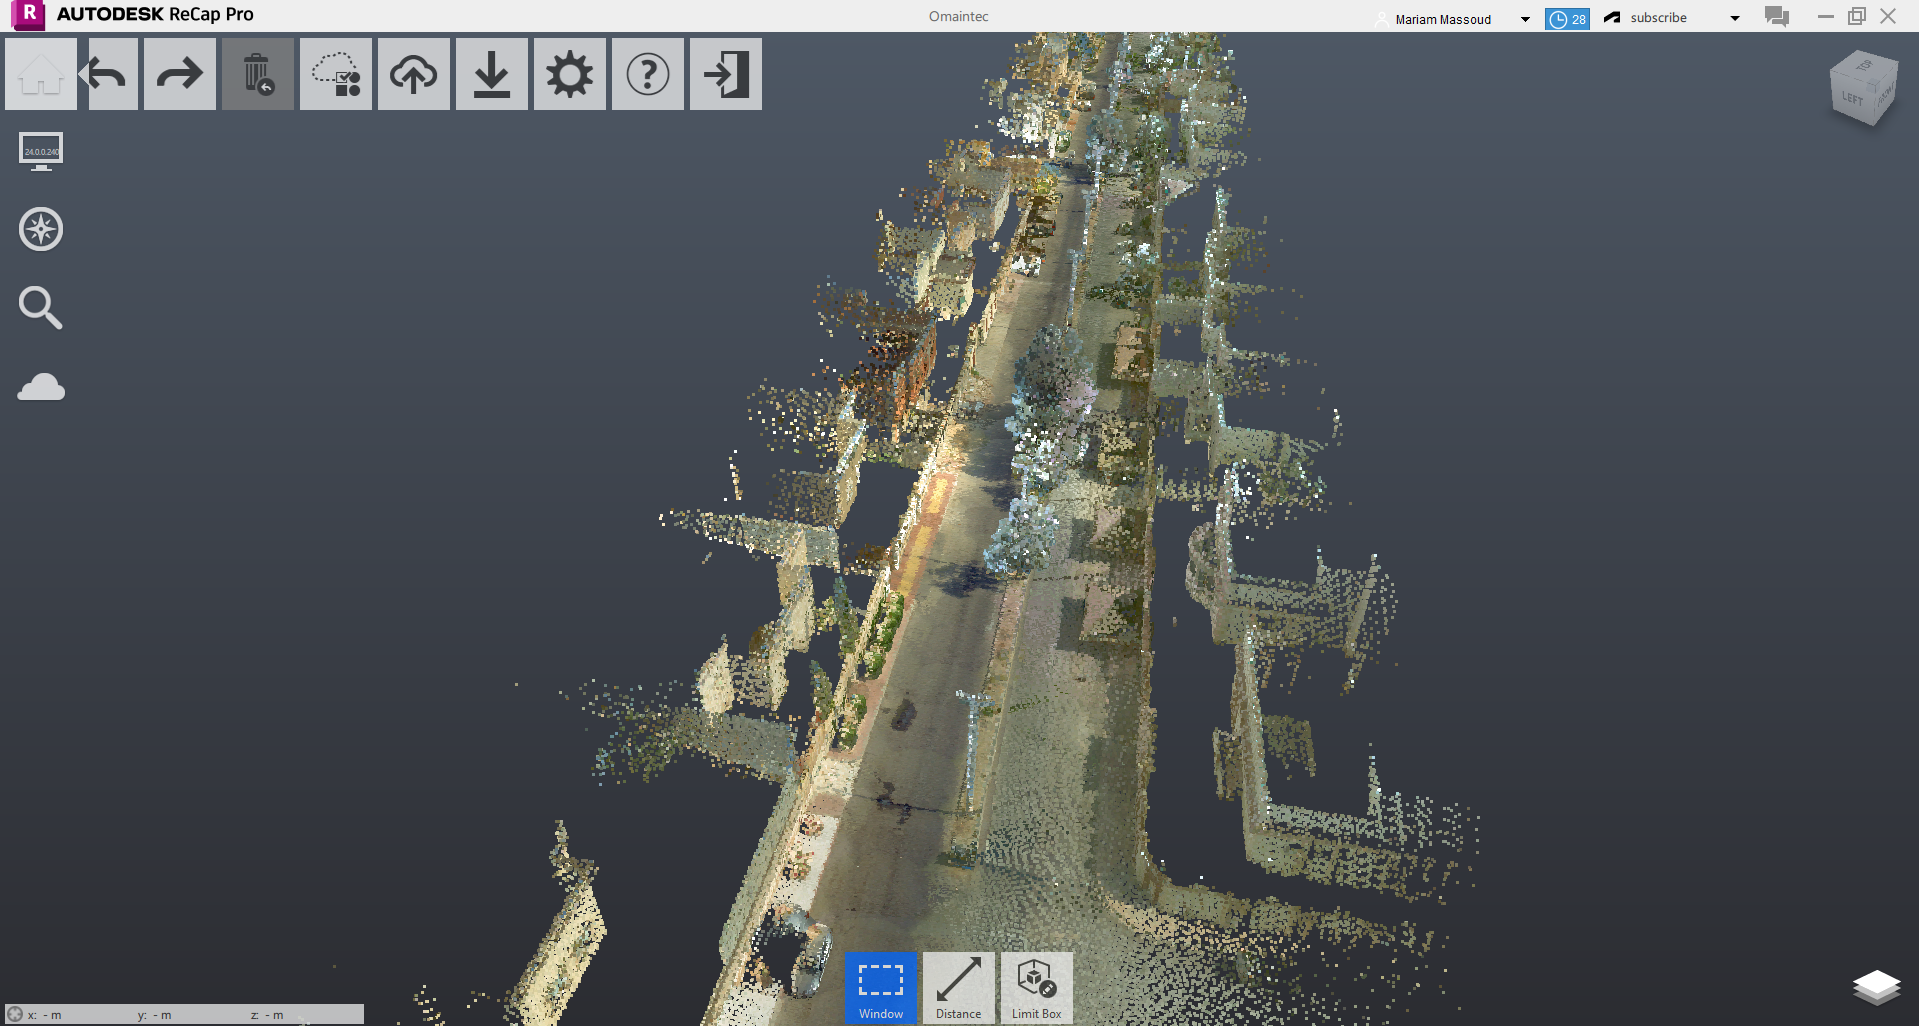
Figure 16: Point cloud data from mobile mapping vehicle. |
|
While the Asset Management System (AMS) equips us with essential planning and management data required for road asset maintenance, we acknowledge the significance of developing a digital twin model. The digital twin will serve as a powerful tool for decision-makers, enabling them to visualize the consequences of their decisions in a digital model. Through the digital twin, decision-makers can explore how the network will be impacted by their choices, making informed and strategic decisions for the road infrastructure.
4.4 Data Analysis Results
Upon the completion of data collection, processing, and subsequent analysis within the AMS framework, our focus shifts to specific details regarding pavement surface distresses, as outlined in table 2, figure 17, and figure18. Additionally, we examine parameters such as Pavement Condition Index (PCI) following ASTM D6433 standards, International Roughness Index (IRI) as per ASTM E1926-08, Ride Number (RN) adhering to ASTM E1489-08(2019), mean profile depth (MPD), friction number (FN), and deflection (D1). These data are comprehensively presented in table 3.
| Section ID | Distress Type | Distress Severity | Distress Area (m2) |
| Section_1 | Alligator Cracking | LOW | 0.513436 |
| Alligator Cracking | MEDIUM | 4.668567 | |
| Longitudinal and Transverse Cracking | LOW | 86.263316 | |
| Longitudinal and Transverse Cracking | MEDIUM | 41.01472 | |
| Patching and Utility Cut Patching | LOW | 19.68143 | |
| Raveling | HIGH | 76.083183 | |
| Raveling | LOW | 34.184812 | |
| Raveling | MEDIUM | 97.691806 | |
| Rutting | LOW | 52.95914 | |
| Rutting | MEDIUM | 16.35253 | |
| Section_2 | Alligator Cracking | LOW | 6.097919 |
| Alligator Cracking | MEDIUM | 1.649015 | |
| Longitudinal and Transverse Cracking | LOW | 166.18967 | |
| Longitudinal and Transverse Cracking | MEDIUM | 97.794961 | |
| Patching and Utility Cut Patching | LOW | 51.529909 | |
| Raveling | HIGH | 63.767378 | |
| Raveling | LOW | 218.959232 | |
| Raveling | MEDIUM | 78.079526 | |
| Rutting | HIGH | 3.98434 | |
| Rutting | LOW | 251.26564 | |
| Rutting | MEDIUM | 43.735 |
Table 2: Pavement Distresses Details in the Study Area.

Figure 17: Pavement Distresses Details in Section_1.

Figure 18: Pavement Distresses Details in Section_2.
| Section ID | Reading Type | The Value |
| Section_1 | PCI_MFV | 35 |
| IRI_Profiler (m/Km) | 3.8 | |
| FN_ (Friction Tester) | 36 | |
| D1_(FWD) (µm) | 350 | |
| Section_2 | PCI_MFV | 45 |
| IRI_Profiler (m/Km) | 5 | |
| FN_(Friction Tester) | 39 | |
| D1_(FWD) (µm) | 330 |
Table 3: The Results from Different Equipment in the Study Area.
4.5 AMS Maintenance and Rehabilitation Planning
Within this section, we present the maintenance decisions derived from the Asset Management System (AMS), accompanied by their corresponding costs as cited in table 4. Following the methodology model, these outcomes will be subsequently sided with the results generated by the Digital Twin Model. This comparative analysis aims to assess the effectiveness and accuracy of the digital twin-based approach against the established decisions from the AMS.
| Section ID | Maintenance Decision Type | Unit Price (SAR/m^2) | Area (m^2) | Cost (SAR) |
| Section_1 | Mill and Overlay | 30 | 864 | 25,920 |
| Deep Patching | 150 | 21 | 3,150 | |
| Section_2 | Mill and Overlay | 30 | 1408 | 42,240 |
| Deep Patching | 150 | 49 | 7350 | |
| Total | 2342 | 40,660 |
Table 4: Maintenance Decision Details.
4.6 Integration Process of Digital Twin Modeling for the Studied Road
Following the outlined methodology in figure 6, the application of digital twin modeling to the studied road involves a systematic progression. Once the required data is collected for on-site assessment, the road follows a series of steps. As initially illustrated in our methodology, the foundational analysis commences within the Asset Management System (AMS). Through data classification and employment of machine learning (ML) algorithms, the Digital Twin (DT) model undergoes continual enhancement. The classified geometric data collected from the field contribute to the creation of a comprehensive 3-D road model. This model is a dynamic entity, iteratively updated through the analyzed and processed data. The collaboration between the AMS and DT model ensures a seamless flow of information, enriching the pavement condition insights.
The integration begins with the AMS, where meticulous analysis of every data fragment occurs. This analytical feed propels the evolution of the DT model, shaping its accuracy and comprehensiveness. The culmination of this process leads to an accurate digital representation of the road’s dynamic condition.
Finally the data visualization, a pivotal interface that empowers decision-makers. This visualization materializes within a web or application platform, where the integration insights are presented. This interface equips decision-makers with the tools to discern the optimal maintenance strategies and prioritize requisite actions. Ultimately, this integration presents a seamless synergy of data, technology, and decision-making, propelling the evolution of pavement maintenance strategies.
5. Conclusion #
In conclusion, our paper highlights the transformative potential of integrating digital twin technology with pavement management systems, fostering a new era of informed decision-making and optimized infrastructure maintenance. Through a detailed exploration of data collection, manipulation, and analysis, we have showcased how this integration empowers stakeholders with real-time insights and predictive modeling capabilities.
The seamless synergy of Asset Management Systems (AMS) and digital twin technology not only addresses the challenges of traditional pavement management methods but also aligns with the evolving landscape of AI technologies in maintenance training and education. This integration acts as a bridge between the physical and virtual worlds, enriching the educational experience by amplifying the practical application of advanced technologies.
The comprehensive methodology we present emphasizes the importance of accurate data, effective analysis, and the utilization of machine learning algorithms, resonating with the future of maintenance training and education in the context of AI technologies. By exploring the fusion of physics-based models and data-driven insights, we have illustrated the benefits of integrating traditional expertise with emerging AI capabilities.
As the transportation industry navigates toward more sustainable, efficient, and cost-effective infrastructure maintenance, the integration of digital twin technology and AMS emerges as a potent strategy. This paper, with its practical case study, technical insights, and educational implications, contributes to both the current discourse and the future trajectory of pavement infrastructure management and maintenance.
In a world driven by technological advancements and the ever-evolving landscape of AI technologies, the integration of digital twins and AMS serves not only as a solution for better infrastructure management but also as a teaching and learning tool, shaping the next generation of maintenance professionals. The journey of integration has just begun, and its significance extends beyond the present, promising a more intelligent, sustainable, and resilient future for our infrastructure systems.
References #
[1] IBM – United States, http://ibm.com.
[2] (OECD,2001) Asset Management for the Roads Sector report in ORGANISATION FOR ECONOMIC CO-OPERATION AND DEVELOPMENT
[3] Fuller, A., Fan, Z., Day, C., & Barlow, C. (2023). Digital Twin: Enabling Technologies, Challenges and Open Research. Retrieved June 26, 2023
[4] (Mehran, 2022) A Digital Twin for Roads: A combined physics and data-driven approach to predict roads deterioration.
[5] Alice Consilvio, José Solís Hernández, Weiwei Chen, Ioannis Brilakis, Luca Bartoccini, Federico Di Gennaro, Mara van Welie (2022) Towards a digital twin-based intelligent decision support for road maintenance.
[6] Cristobal Sierra, et al. “Development of a Cognitive Digital Twin for Pavement Infrastructure Health Monitoring.” MDPI, https://www.mdpi.com/2412-3811/7/9/113.
[7] “IP-S3 – Capture reality at vehicle speeds | Topcon Positioning.” Topcon Positioning Systems, https://www.topconpositioning.com/scanning/mobile-mapping/ip-s3 .
[8] “Laser Crack Measurement System (LCMS).” Pavemetrics, https://www.pavemetrics.com/applications/road-inspection/lcms2-en/.
[9] “FastFWD – Fast Falling Weight Deflectometer.” Dynatest, https://dynatest.com/equipment/fast-falling-weight-deflectometer/
[10] “Ground Penetrating Radar Equipment | RoadScan 30 | GSSI.” Geophysical Survey Systems, Inc., https://www.geophysical.com/products/roadscan
[11] “PFT – Pavement Friction Tester.” Dynatest, https://dynatest.com/equipment/pavement-friction-tester/


