


Ibrahim M. Asi*, Aya I. Al-Asi

Regional Center of Excellence for Pavement Studies & Evaluation Manager Arab Center for Engineering Studies (ACES) – Amman, Jordan
Teacher at Civil Engineering Department.. Applied Science University – Amman, Jordan
In this paper there are details about the four pavement performance evaluation characteristics, their meaning, measuring techniques, specification limits and required maintenance and rehabilitation techniques for each.
To illustrate methods of measuring the four characteristics and reporting the results a case study is presented about a recently performed pavement evaluation project for Dubai International Airport.
Pavement Performance Evaluation #
Transportation is a catalyst for development of any society. Road transportation is considered as veins and arteries of a nation, thus roads are constructed with variety of materials & specifications to mitigate the connectivity problems. Therefore, highest care is always taken in designing & developing the road networks. This is usually done by designing the network of roads or designing components of roads or in considering materials for construction [1]. Hence, it is very essential to analyze pavements for their responses on application of vehicular loads. Due to repeated application of loads, the performance of the pavement deteriorates and hence damage assessment procedures are required to be carried out to rectify the defects produced in the pavements to provide the required performance by conducting tests and surveys like structural surveys, distress surveys, texture depth & skid resistance surveys and pavement surface roughness surveys.
The ability of a pavement to withstand traffic and airplanes loads in a safe, comfortable and efficient manner is adversely affected by the different types of the pavement distresses. Therefore, monitoring the performance of pavement will help to determine the current condition of the pavements and, consequently, a management plan for maintenance, rehabilitation, or reconstruction [2, 3].
Four characteristics of pavement condition are usually objectively measured to evaluate pavement performance and need for rehabilitation. These measurable characteristics are:
Structural evaluation – pavement deflection, cores and test pits; Functional evaluation -pavement roughness (rideability); Surface condition evaluation – pavement distresses; and
Safety evaluation – skid resistance.
Structural evaluation #
Pavement structural evaluation is concerned with the structural capacity of the pavement as measured by deflection, layer thickness, and material properties. It is used to obtain information on the load-bearing capacity for both roads and airports to evaluate the need for maintenance and rehabilitation, asset pavement evaluation, and construction quality control.
Non-destructive testing has become an integral part of pavement structural evaluation and rehabilitation strategies in recent years. The falling weight deflectometer (FWD) is considered the most popular equipment used for non-destructive testing of airports and highways. FWD applies a load to the pavement and deflections are measured directly under the load and at set distances from the load. These recorded deflections are processed by back analysis software to estimate the modulus of each pavement layer and required overlay depth for the future design traffic. In small projects, the Benkelman beam can be used to assess structural adequacy of the pavement layers.
At project levels, destructive evaluation of the pavement can be used to evaluate its structural adequacy. Destructive evalauation includes extraction of cores, excavation of test pits, bore holes and trenches, etc.
Functional evaluation #
Functional evaluation of pavements is primarily concerned with the ride quality or surface texture of a pavement section. Everyone who drives or rides in a vehicle over the surface of a highway pavement or inside an airplane over an airport pavement can subjectively judge the smoothness of the ride. Pavement roughness is defined as an expression of irregularities in the longitudinal profile of its surface that adversely affects the ride quality of a vehicle or an airplane, thus causing discomfort to the user. These irregularities lead to uncomfortable feeling for pavement users [4].
Smoother pavements are required because they provide comfort and safety to pavement users, reduce vehicle/airplane operating cost by reducing fuel and oil consumption, tire wear, maintenance cost and vehicle depreciation, and reduce pavement maintenance cost. Smooth pavements result in less dynamic loading from heavy trucks/airplanes loading, which reduces pavement distresses thus resulting in less maintenance and lower life cycle cost. Therefore, it is expected that smoother pavements will last longer [5].
There are two main methods for measuring road smoothness. These are subjective ride quality surveys (serviceability surveys); and objective roughness surveys.
Profiling devices, which are objective roughness survey systems, are used to provide accurate, scaled, and complete reproductions of the pavement profile. Among the most advanced profiling devices are laser profilers, which use non-contact laser sensors to measure differences in the pavement surface. To eliminate vehicle body motion and compute road longitudinal profile, accelerometers are placed on the measuring vehicle body to measure its vertical motion.
The International Roughness Index (IRI) is a scale for roughness based on the simulated response of a generic motor vehicle to the roughness in a single wheel path of the pavement surface. IRI is an index for roughness measurement obtained by road meters installed on vehicles or trailers. IRI true value is
determined by obtaining a suitably accurate measurement of the profile of the pavement, processing it through an algorithm that simulates the way a reference vehicle would respond to the roughness inputs, and accumulating the suspension travel. It is normally reported in inches/mile or meters/kilometer.
In South Carolina, IRI values are derived from wheel path profiles obtained using non-contacting inertial profilers. Typically, IRI data readings are taken at 0.16 km (0.10 mile) intervals and then are averaged [6]. IRI values less than 2.68 m/km (170 inch/mile) are considered acceptable and any IRI value less than 1.50 m/ km (95 inch/mile) indicates good roughness condition of the pavement [7]. For newly constructed or re- surfaced pavements in UAE, the acceptable ride quality of each completed lane of asphalt wearing surface for roads with speed limits greater than or equal to 100kph shall be less than 0.90 m/km. When any 100m section of completed road lane exceeds the specified IRI value of 0.90, it shall be considered deficient and unacceptable, it shall be rectified by removal, and replacement to meet the specified IRI limits [8].
Another parameter which is usually used to judge pavement roughness is Rolling Straight Edge (RSE) value, which is performed using rolling straightedge evaluation for the profiles collected using inertial profilers. It determines the vertical deviation between the center of the straightedge and the profile for every increment in the profile data.
Specifically for airports’ pavements, Boeing Bump Index (BBI) analysis is used to qualify pavements in the airports. The basis of the Boeing Bump analysis method is to construct a virtual straightedge between two points on the longitudinal elevation profile of a runway/taxiway and measure the deviation from the straightedge to the pavement surface. The procedure reports “bump height” as a maximum deviation (positive or negative) from the straightedge to the pavement. Bump length is the shortest distance from either end of the straightedge to the location where the bump event is measured. The procedure plots bump height and bump length against the acceptance criteria [9].
Boeing Bump Index (BBI) is determined by computing the bump height and bump length for all straightedge lengths for all sample points in the profile. For each straightedge length, the limit of acceptable bump height is computed for the computed bump length. For each straightedge length, the ratio (measured bump height) / (limit of acceptable bump height) is calculated. The BBI for the selected sample point is the largest computed ratio (Index) for all computed straight edges for the selected sample point. If the computed Boeing Bump Index value is less than 1.0 roughness falls in the acceptable zone, if it is greater than 1.0, it falls in the excessive or unacceptable zone [9].
Surface condition evaluation #
Pavement condition refers to the condition of the pavement surface in terms of its general appearance. A perfect pavement is leveled and has a continuous and unbroken surface, while a distressed pavement may be fractured, distorted, or disintegrated. In order to obtain a useful condition assessment of the pavements, unbiased and repeatable survey procedures must be used. To provide for maximum usefulness, the survey procedures must be easily understood and relatively simple to perform in the field.
The most common survey technique used in the US and World Wide is the Pavement Condition Index (PCI) procedure developed by the US Army Corps of Engineers. The condition of the pavements is determined by a field survey of the surface operational condition of all pavements using this procedure. The PCI –
a measure of the pavement’s surface operational condition and ride quality on a scale of zero to 100, with 100 being excellent – has several unique qualities, which make it a useful visual surveying tool. It agrees closely with the collective judgment of experienced pavement engineers and has a high degree of repeatability [10, 11].
Patted, Vinodkumar, Shivaputra and Poornima [1] in their research developed a maintenance criterion for all the road stretches they have evaluated based on the pavement condition index values.
Kutkhuda [12] conducted a comprehensive study for the Municipality of Greater Amman in Jordan, which was financed by the World Bank. In the study, a pavement management system (PMS) was developed and implemented for Greater Amman. The PMS included a diagnostic stage, which consisted of assessment and evaluation of the existing pavement condition.
The PCI method was standardized and was included in ASTM Standards. The three ASTM Standard Procedures are:
ASTM D5340-12 “Standard Test Method for Airport Pavement Condition Index Surveys”.
ASTM D6433-18 “Standard Test Methods for Roads and Parking Lots Pavement Condition Index Surveys”.
ASTM E2840 − 11 (2015) “Standard Test Methods for Pavement Condition Index Surveys for Interlocking Concrete Roads and Parking Lots”.
The PCI has several unique qualities which make it a useful visual surveying tool; it agrees closely with the collective judgment of experienced pavement engineers and has a high degree of repeatability. It provides a standardized and objective method for rating the structural integrity and operational surface condition of pavement section. Furthermore, it is used for determining M&R needs and priorities by comparing the condition of different pavement sections, and for determining pavement performance from accumulated data.
PCI is a numerical index based on a scale from 0 to 100 with a value of 100 being a pavement in excellent condition, whereas a value of 0 represent an impassible pavement. The PCI is determined based on quantity, severity level and type of distress. The PCI has been divided into seven condition rating categories ranging from “excellent” to “failed”. These categories are useful for developing maintenance policies and guidelines.
Prior to conducting the PCI survey, a preliminary field survey is usually carried out to divide the total length of the pavements into sections of similar certain consistent characteristics and conditions. These characteristics include pavement structure, traffic, construction history, pavement rank, drainage facilities, shoulders, and condition.
These sections are then decomposed into smaller inspection units called “sample units”. A sample unit is defined as any easily identified, convenient area of a pavement section which is designed only for the purpose of pavement inspection. A sample unit is a conveniently defined portion of a pavement section designated only for the purpose of pavement inspection. For asphalt surfaced roads, a sample unit is defined as an area 230 ± 90 sq. m. While for asphalt surfaced airfields, each sample unit area is defined as 460 ± 180 sq. m. While for concrete roads and airfields with joints spaced less than or equal to 7.6m, the recommended sample unit size is 20 ± 8 slabs. For slabs with joints spaced greater than 7.6m, imaginary joints less than or equal to 7.6m apart and in perfect condition, should be assumed.
Deduct values associated with each distress type, severity and quantity combination are then determined and used to compute the final PCI value for each inspection unit. Depending on the final PCI value a pavement condition rating which is a verbal description of pavement condition is specified for each inspection unit and is also specified for the pavement section as a whole [10].
Safety evaluation #
Worldwide, more than 1 million person is killed yearly due to traffic accidents. Although high percentage of these accidents is due to drivers errors, but highways have a significant effect on this high percentage of traffic accidents. The most important factor in the highways affecting traffic accident rates is the skid resistance. Accident rates increase in the rainy season especially after the initial rain showers. One of the main reasons for this increase is attributed to the low skid resistance of the highway surfaces. In addition, a number of the drivers do not give much attention to the depth of the grooves in their tires treads, and their driving habits do not change much during the rain period [13].
Surface friction or skid resistance is considered a safety characteristic of the pavement surface layers. Skid resistance is a measure of the resistance of pavement surface to sliding or skidding of the vehicle. It is a relationship between the vertical force and the horizontal force developed as a tire slides along the pavement surface. Therefore, the texture of the pavement surface and its ability to resist the polishing effect of traffic is of prime importance in providing skidding resistance.
- Skid resistance is an important pavement evaluation parameter because:
- Inadequate skid resistance will lead to higher incidences of skid related accidents.
- Most agencies have an obligation to provide users with a roadway that is ‘‘reasonably’’ safe.
- Skid resistance measurements can be used to evaluate various types of materials and construction practices.
Skid resistance depends on a pavement surface’s microtexture and macrotexture [14]. Microtexture refers to the small-scale texture of the pavement aggregate component (which controls contact between the tire rubber and the pavement surface); therefore, it is produced from the coarse aggregate. Macrotexture refers to the large-scale texture of the pavement as a whole due to the aggregate particle arrangement (which controls the escape of water under the tire and hence the loss of skid resistance at high speeds) [15]. Therefore, macrotexture is controlled by the shape, size, gap width, layout, and gradation of the coarse aggregates [16].
Developing Performance Models #
Pavement performance prediction models are essential for a complete pavement management system. Condition prediction models are used at both the network and project levels management. At the network level, prediction models uses include condition forecasting, budget planning, inspection scheduling, and work planning. One of the most important network uses of prediction models is to conduct “what if” analysis to study the effects of various budget levels on future pavement conditions [17].
Performance modeling requires historical record of the objective function (performance) variation with age (time). If such record is not available, then the alternative method is to use family method. The method consists of the following steps [10]:
- Define the pavement family such as major, collector or service roads.
- Filter the data for errors or mistakes.
- Conduct data outlier analysis. Data within X ± 2σ should be included for family model development.
- Build the family model using regression technique.
Mostaqur Rahman with his coauthors [18] developed pavement performance evaluation models using data from primary and interstate highway systems in the state of South Carolina, USA. In their research, twenty pavement sections were selected from across the state, and historical pavement performance data of those sections were collected. In their developed models, four different performance indicators were considered as response variables: Present Serviceability Index (PSI), Pavement Distress Index (PDI), Pavement Quality Index (PQI), and International Roughness Index (IRI). Annual Average Daily Traffic (AADT), Free Flow Speed (FFS), precipitation, temperature, and soil type were considered as predictor variables. Results showed that AADT, FFS, and precipitation have statistically significant effects on PSI and IRI for both Jointed Plain Concrete Pavement (JPCP) and Asphalt Concrete (AC) pavements.
Case Study- Pavement Performance Evaluation of Dubai International Airport #
To demonstrate the use of Pavement Performance Evaluation in general and for airports in specific, the performed pavement evaluation of Dubai International Airport in the period 2016 – 2017 by Arab Center for Engineering Studies (ACES) is explained in this paper. For the confidentiality of the obtained tests results, only performed evaluation tests in Dubai International Airport will be explained in this paper with examples of normally obtained results that are from any of the evaluated airports by ACES.
Structural evaluation #
The used Falling Weight Deflectometer in the structural evaluation study was the Super Heavy Falling Weight Deflectometer (SH-FWD). It is capable of applying loads to the pavement that stimulate moving heavy wheel loads in both magnitude and duration up to 300 kN, Photo 1. The used SH-FWD can be used for
deflection measurements on airports, roads and granular surfaces. It is equipped with T-beam extension bar for measurements behind and next to loading points on concrete slabs; to evaluate deflection load transfer efficiency (LTE) factor from the loaded slab to the unloaded slab for rigid pavement slabs and flexible pavement overlaid rigid pavement slabs.

Photo 1: Used SH-FWD in pavement structural evaluation.
The structural evaluation study included both North and South Runways with their Associated Taxiways, Taxilinks, Rapid Exits and Holding Bays, in addition to General Service Equipment (GSE) roads. A total of 2020 FWD test points were selected to conduct the deflection tests. Locations of some of the tested points on Google Maps view for Dubai International Airport are shown in Figure 1. Test points on the runways were at 6.25m, 2.9m and 1.9 offset distances to the right and left from the center line at 50m and 100m spacings. While on the taxiways, taxi-links, rapid exits and holding bays they were at 2.9m and 6.25m offset distances to the right and left from the center line at 100m and 200m spacings. On the GSE Roads, FWD tests were performed in the center of both traffic lanes at 200m spacing. On the concrete slabs, FWD tests were performed on the center, corner and edge of the selected concrete slabs. Edge and corner slabs FWD tests were used to calculate the load transfer efficiency (LTE) between the slabs.
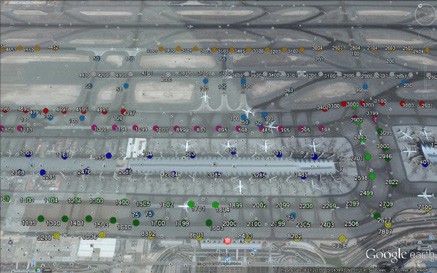
Figure 1: Locations of some of the tested points on Google Maps view of Dubai International Airport.
The measuring cycles at each FWD test point consisted of four drops. One set drop and three measuring drops. The set drop was used to adjust the FWD plate position on the pavement surface. The three other drops were the measuring drops. The latter drops were compared with each other and with the maximum allowable deflection of the FWD geophones, i.e., 2200 micron. If the deflection data looked suspicious, or the deflection difference for any sensor was greater than 5% or 5 microns -whichever was smaller- or the actual test loads were not within 5% of the target load, the test sequence was repeated at the same location or at an adjacent location at the same levels of loads. If the measured results were acceptable, then the results were stored and the operator would move to the next measuring point. Testing was not conducted near cracks. The used FWD load in evaluating the runway and taxiways was 215 KN, and was 55 KN for the GSE roads.
RoSy DESIGN for Aircraft Loads software was used to calculate the pavement layers’ moduli and Pavement Classification Numbers (PCN) at the different test points. Figure 2 shows a typical output of RoSy DESIGN software. Figure 2 includes calculated E moduli values for each pavement layer, layer 1 is the asphalt layer, layer 2 is the granular base layer, Layer 3 is the granular subbase layer and layer 4 is the subgrade layer, thicknesses of each pavement layer, pavement type and calculated PCN values and Airplane Classification Number (ACN) values for the Critical Design Aircraft.

Figure 2: Obtained typical FWD analysis report.
LTE were calculated for both corner and middle of edge of the slab locations and were classified according to FAA AC150/5370-11B “Use of Nondestructive Testing in the Evaluation of Airport Pavements” into “Acceptable”, “Fair” and “Poor” conditions [19], Figure 3.

Figure 3: Distribution of the obtained LTE values.
Functional evaluation #
Australian Road Research Board (ARRB) laser profiler, Photo 2, was used to obtain roughness of the runways, taxiways and rapid exits. The system is a portable data collection roughness measurement equipment consisting of a precision laser profiler, combined with a high-resolution camera. The laser profiler is a World Bank Class 1 profiler, consisting of two precision laser sensors and accelerometers that are used to compensate for vehicle body movement.

Photo 2: Used Laser Profiler in pavement roughness evaluation.
The IRI measurement lines were limited to the central strip of the tested facility (i.e. 2 lines per facility in the most favorite direction of traffic, at 6m offsets from each side of the centerline). Roughness data analysis was performed by calculating average IRI values for each 25m, 100m and 200m, lengths for each sensor. Figure 4 shows Variation of average IRI values for each test path, i.e. 6 m left of the Center line and 6 m right of the Center line.

Figure 4: Variation of average IRI values for each test path.
In addition to IRI calculation, the laser profiler Hawkeye analysis program produced ERD output files for each test run. The produced ERD files were analyzed using ProVAL computer program to calculate the Rolling Straight Edge (RSE) values for each section.
The RSE simulation in ProVAL simulates RSE measurement from profiles collected using inertial profilers. It can determine the vertical deviation between the centre of a straightedge and the profile for every increment (2.5cm) in the profile data. For all the collected roughness data, RSE indices were computed and scallops were identified.
The default input values that were used in ProVAL software were:
- Straightedge Length: 3.05m (10.0ft).
- Deviation Threshold: This is the threshold values to determine out of limit areas 3.00mm (0.118”).
Figure 5 shows the obtained RSE values superimposed on the acceptance criteria for surface evenness according to International Standards and Recommended Practices (ICAO) Annex 14 – Aerodromes_V1_ Aerodrome Design and Operations (7th Edition) [20].

Figure 5: Encountered RSE bumps heights and bumps lengths on surveyed taxiways superimposed on ICAO roughness criteria.
The produced ERD files from the laser profiler analysis program were analyzed using ProFAA computer program to calculate the “Boeing Bump Index” (BBI) for the surveyed taxiways. “ProFAA” is Federal Aviation Administration’s computer program for computing pavement elevation profile roughness indices. BBI is determined by computing the bump height and bump length for all straightedge lengths for all sample points in the profile. For each straightedge length, the limit of acceptable bump height is computed for the computed bump length.
For each straightedge length, the ratio (measured bump height) / (limit of acceptable bump height) is calculated. The BBI for the selected sample point is the largest computed ratio (Index) for all computed straight edges for the selected sample point. The specified Boeing Bump Index limits in FAA AC No: 150/5380-9 Guidelines, specifies the bump as “Acceptable” if it falls in the “Acceptable Zone”, i.e., if the computed BBI value is less than 1.0, while if computed BBI is greater than 1.0, it falls in the “Excessive” or “Unacceptable” zones [9]. Figure 6 shows the variation of BBI values along one of the surveyed taxiways.

Figure 6: Variation of BBI values for both sensors along surveyed taxiway (6m North of Center Line).
Surface condition evaluation #
The PCI method was used in evaluating the included pavements of Dubai International Airport, Photo 3. ASTM D5340-12 “Standard Test Method for Airport Pavement Condition Index Surveys” was followed in evaluating the runways, taxiways, taxilinks and rapid exits. While ASTM D6433-18 “Standard Test Methods for Roads and Parking Lots Pavement Condition Index Surveys” was used in evaluating the GSE roads surrounding the internal airport facilities. In addition, ASTM E2840 − 11 (2015) “Standard Test Methods for Pavement Condition Index Surveys for Interlocking Concrete Roads and Parking Lots” was followed in evaluating the interlocking concrete GSE roads.

Photo 3: PCI Evaluation of the GSE roads.
The first step in the PCI evaluation was dividing the included pavement parts into three networks, Network One for the runways, associated parallel taxiways and their taxilinks, Network Two for the associated taxiways around concourses with their taxilinks and Network Three for the GSE roads. Selected Networks were divided into Branches of readily identifiable parts of the pavement with distinct use. The Branches were divided into Sections of same construction history, traffic, pavement rank (or functional classification), drainage facilities, shoulders, condition and size. Finally the Sections were divided into Sample Units.
The Sample Units that were selected for inspection were selected according to the specified sampling procedure in each of the corresponding ASTM Method to obtain a statistically adequate estimate (95% confidence) of the PCI of the section.
All the selected Sample Units for inspection were inspected and the PCI values of the inspected Sample Units with their corresponding Sections were calculated using Paver Version 6.5.7 software, Figure 7.

![]()
Figure 7: Calculated Sample Units and corresponding Sections’ PCI values.
Total distresses quantity tables for each Section were generated and pavement maintenance assignment procedure was assigned for each Section according to obtained PCI value for that Section or Subsection, Figure 8.

Figure 8: Pavement maintenance assignment procedure for the surveyed Sections.
Safety evaluation #
The operator of any airport with significant jet aircraft traffic should schedule periodic friction evaluations of each runway end. Every runway end should be evaluated at least once each year. Depending on the volume and type (weight) of traffic on the runway, evaluations will be needed more frequently, with the most heavily used runways needing evaluation as often as weekly. According to FAA Advisory Circular No: 150/5320-12D [21], all airports with turbojet traffic should own or have access to Continuous Friction Testing Equipment (CFME), not only is it an effective tool for scheduling runway maintenance, it can also be used in winter weather to enhance operational safety. Figure 9 shows a sample of a generated variation of friction coefficient graph for a runway to categorize its friction coefficients into “Acceptable”, “Maintenance Planning” and “Minimum Acceptable Friction Level” zones.
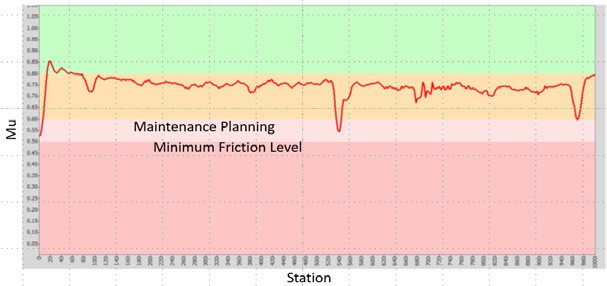
Figure 9: Sample of a generated variation of friction coefficient graph for runway surface.
References #
- A. Patted, Vinodkumar, Shivaputra and Poornima. “Pavement Performance and Functional Evaluation for Selected Stretches”, IJSRD – International Journal for Scientific Research & Development|, Vol. 4, Issue 03, available online, (2016).
- Y. O. Adu-Gyamfi, N. O. Attoh-Okine and C. Kambhamettu. “Functional Evaluation of Pavement Condition Using a Complete Vision System”, Journal of Transportation Engineering, Volume 140 Issue 9, pp. 1-10, (2014).
- B. Huang, T. F. Fwa and W. T. Chan. “Pavement-distress data collection system based on mobile geographic information system”, Transportation Research Record 1889 , Transportation Research Board,Washington, DC., (2004).
- M. Sayers and S. Karamihas. “The Little Book of Profiling”, The Regent of the University of Michigan, Michigan, 1998.
- T. Al-Rousan and I. M. Asi. “Utilization of Reclaimed Asphalt Pavement (RAP) in Jordan Roadways,” Proceedings of The First International Syrian Road Conference, Ministry of Transport, Damascus, Syria, (2007).
- R. L. Baus and W. Hong. “Development of profiler-based rideability specifications for asphalt pavements and asphalt overlays”, Federal Highway Administration, Report GT04-07, (2004).
- Federal Highway Administration (FHWA). Pavement smoothness methodologies, FHWA-HRT-04-061-145-91, <www. fhwa.dot.gov/pavement/smoothness/index.cfm>, (2004).
- Abu Dhabi City Municipality, Department of Municipal Affairs. “Standard Specifications for Roads”, Version 2, Abu Dhabi, UAE, (2014).
- Federal Aviation Administration. “Guidelines and Procedures for Measuring Airfield Pavement Roughness,” U.S. Department of Transportation, AC No: 150/5380-9, (2009).
- M. Y. Shahin and J. A.Walter. “Pavement Maintenance Management for Roads and Streets Using PAVER system”, US Army Corps of Engineers, Construction Engineering Research Laboratory (USACERL), Technical Report M-90/05, USA, (1990).
- M. Y. Shahin. Pavement management for airports, roads, and parking lots, Springer, New York, USA, (2005).
- I. Kutkhuda. “Development a Pavement Maintenance Management System for Greater Amman Municipality”, Arab Center for Engineering Studies Report, SPR900013, Amman, Jordan, (2009).
- I. M. Asi. “Evaluating Skid Resistance of Different Asphalt Concrete Mixes,” Building and Environment Journal, Scotland, Volume 42, Issue 1, pp. 325-329, (2007).
- R. Haas, R. Hudson and J. Zaniewski. “Modern Pavement Management,” Krieger Publishing Company Malabar, FL, USA, (1994).
- Pavement Management Committee. “Pavement Management Guide,” Roads and Transportation Association of Canada, Canada, (1977).
- T. Fwa, Y. Choo and Y. Liu. “Effect of aggregate spacing on skid resistance of asphalt pavement,” The Journal of Transportation Engineering, ASCE, 129 (4): 420–6, (2003).
- H. I. Al-Abdul Wahhab, R. H. Malkawi, I. M. Asi and J. Yazdani. “Dammam Municipality Pavement Management System (DMPMS)”, The 6th Saudi Engineering Conference, KFUPM, Dhahran, pp. 455-368, (2002).
- M. Mostaqur Rahman, M. Majbah Uddin and S. L. Gassman. “Pavement performance evaluation models for South Carolina”, KSCE Journal of Civil Engineering, Volume 21, Issue 7, pp 2695–2706, (2017).
- Federal Aviation Administration. “Use of Nondestructive Testing in the Evaluation of Airport Pavements,” U.S. Department of Transportation, AC No: 150/5370-11B, (2011).
- International Civil Aviation Organization (ICAO). “Annex 14 – Aerodromes_V1_Aerodrome Design and Operations,” International Civil Aviation Organization, 7th Edition, (2016).
- Federal Aviation Administration. “Measurement and Maintenance of Skid-Resistant Airport Pavement Surfaces,”U.S. Department of Transportation, AC No: 150/5320-12D, (2016).


