



Dr. Fawaz Alharbi
Department of Civil Engineering, College of Engineering, Qassim University, Buraydah 51452, Saudi Arabia, Email: fawazalharbi@qu.edu.sa
Abstract
Meeting international air quality requirements is extremely challenging in Saudi Arabia, especially given the difficulties in assessing air pollution caused by traffic and the development of secondary pollutants including ozone (O₃) and small particulate matter (PM₂.₅). The sensitivity of current air quality models is frequently insufficient to evaluate the short-term effects on environmental quality of dynamic traffic situations, such as those brought on by temporary construction zones. This paper proposes a digital twin-based framework to assess and mitigate the environmental impacts of road work zones by integrating real-time traffic data, air quality measurements, and predictive analytics.
The severity of these effects is illustrated by a case study that gathers average daily traffic during rush hour and related air quality indicators (CO, NO₂, O₃, PM₁₀, PM₂.₅, CO₂). According to the results, there was a 145% rise in PM₁₀ levels during a work zone closure compared to pre-closure readings for every 15% increase in peak-hour traffic. Furthermore, there was a significant positive association found between CO2 concentrations and traffic volume. These results demonstrate the critical need for instruments capable of dynamically simulating and tracking these kinds of environmental disruptions.
Through the use of digital twins, which are virtual representations of road segments enhanced with real-time data and simulation capabilities, this study makes it possible to analyze emissions and air quality in real-time under various traffic management and construction scenarios. The creation of a statistical model to assess and suggest mitigation techniques, including adaptive detour planning, optimal scheduling, and emissions-reducing measures, is also supported by the digital twin architecture. This strategy complements Saudi Arabia’s sustainability objectives within the Vision 2030 framework and is a revolutionary step toward environmentally intelligent work zone management.
Keywords
Road Work Zones, Air Quality, Sustainable Transportation, Digital Twin, Saudi Arabia, Smart Infrastructure.
1. Introduction #
The long-term viability, safety, and operation of transportation systems depend on maintaining and improving the infrastructure of the roads. Temporary activity, however, can heighten local environmental consequences and seriously disrupt traffic patterns. These disturbances frequently result in higher levels of noise and dust pollution from construction operations, as well as increased emissions from traffic, rerouting, and vehicle idling. Numerous researches have established the health concerns associated with residing near work zones. (Font, et al., 2014). The WHO estimated that the outdoor air pollution in both urban and rural areas likely contributed to approximately 4.2 million deaths globally in 2016. Research indicated that exposure to fine particulate matter, specifically that which is 2.5 microns or less, is more likely to be the cause of the aforementioned mortality rate (WHO, 2025).
In Saudi Arabia, the rapid pace of urbanization and infrastructure development presents growing environmental and operational challenges. With major investments under Vision 2030, the expansion of road networks and urban corridors has accelerated, which may require more to meet global air quality standards. Urban areas like Riyadh, Jeddah, and Dammam frequently experience exceedances in pollutant levels, particularly nitrogen dioxide (NO₂), ozone (O₃), and particulate matter (PM₁₀, PM₂.₅), which is directly or indirectly linked to traffic emissions (Alharbi, Shareef, & Husain, 2015). The air pollution remains a pressing issue, particularly in urban centers such as Riyadh, Jeddah, and Dammam. According to the World Health Organization, the air pollution in the kingdom of Saudi Arabia is responsible for 26% of death from stroke and ischemic heart disease, moreover, the average concentration of PM2.5 is approximately eleven times higher than the World Health Organization’s recommendation air quality guideline value (WHO, 2023). In Qassim region, the PM concentrations were higher than allowable limits, especially during dust storms. The average values of PM1, PM2.5, and PM10 were 12.23, 33.16, and 155.38 μg/m³ in urban regions and 8.18, 23.03, and 93.57 μg/m³ in rural areas (Alnagran, Mansour, Alashrah, Suardi, & Abdul Rahman, 2023).
One of the significant limitations in current practice is the reliance on static air quality models, which are not well-suited to evaluate the short-term, high-impact changes associated with temporary work zones. These conventional models often lack real-time processing and prediction functionalities, therefore, limiting their effectiveness in proactively mitigating pollution risks (Ramadan, Ali, Khoo, Alkhedher, & Alherbawi, 2024). Consequently, their utility in operational planning and mitigation of environmental harm is limited. Therefore, a thorough analysis of emissions from work zones, it is necessary to describe the correlation between the pollutant levels and the various factors that may influence, such as weather, traffic volume, and equipment.
To address these limitations, the study explores the use of Digital Twins (DTs) virtual replicas of physical systems continuously updated with real-time data for assessing and mitigating the environmental impacts of work zones. According to the Digital Government Authority, the DT is a management approach that enhance situational awareness and, consequently, decision-making to support new or enhanced business objectives (Digital Goverment Authority, 2021).
In transportation infrastructure management, the Digital Twin (DT) is increasingly used to optimize traffic flow and transportation systems. The DT models are used in the design stage to simulate, test, and optimize physical systems in a virtual environment. They allow engineers to detect issues early, refine designs, and evaluate performance across parameters like structural integrity, energy efficiency, and operational effectiveness. Digital twins have considerable potential for environmental applications. By combing meteorological information, traffic modeling tools, and air quality sensors. DTs also enable real-time collaboration among engineers, architects, and contractors through a shared virtual platform, ensuring seamless data exchange, better coordination, and greater accuracy in the design process (Yan, et al., 2023). This capability enables proactive, data-informed decision-making on work zone design, scheduling, and detour management. In Saudi Arabia, the key component of Vision 2030, which priorities digital infrastructure, sustainability, and livability, is the implementation of smart city technology (Vision 2030, 2016).
The objectives of this study are to identify the key variables that contribute to increased emissions in road construction work zones, to assess the levels of emissions generated within these zones, and to develop a statistical model capable of estimating emission levels for each work zone based on the field datasets, because of the limited of air quality studies in the KSA. In addition, the study proposes a Digital Twin framework that integrates real-time data from traffic and environmental sensors, dynamic traffic simulation models, and statistical analyses of pollutant behavior. This framework aims to evaluate the environmental footprint of various work zone scenarios and determine optimal strategies to reduce emissions and minimize air pollution exposure, particularly in dense urban environments, this integration of DT in environmental assessments contributes in achieving the smart and sustainable infrastructure goals as outlined in Saudi Vision 2030, which emphasizes environmental stewardship, digital transformation, and innovation in public services (Vision 2030, 2016).
2. Methodology #
2.1 Study Area Selection #
A thorough explanation of the study design is given, including sampling locations for vehicle emissions along specific study routes. The selection of relevant factors was guided by findings from previous studies reported in the literature review. Vehicle emission concentrations are classified into two categories: peak-hour and off-peak-hour traffic data. Alternatively, measurements can be taken both within the work zone and upstream of it to ensure comparable conditions. This approach enables the study to assess the effect of traffic congestion in the work zone on emission concentration levels. Data collection was organized into tables to record the site location, surrounding neighborhood, the number of open and closed lanes, and the calculated traffic flow within the work zone. Emission measurements were then conducted at these sites. The selection of work zones was based on several criteria, including work zone length, quantity of construction equipment, average daily traffic, number of lanes, construction duration, posted speed limit, and observed average speed. Figure 1 presents the location of Buraydah City, situated approximately in the geographical center of the Kingdom of Saudi Arabia, while Figure 2 illustrates the selected work zone sites within the city.
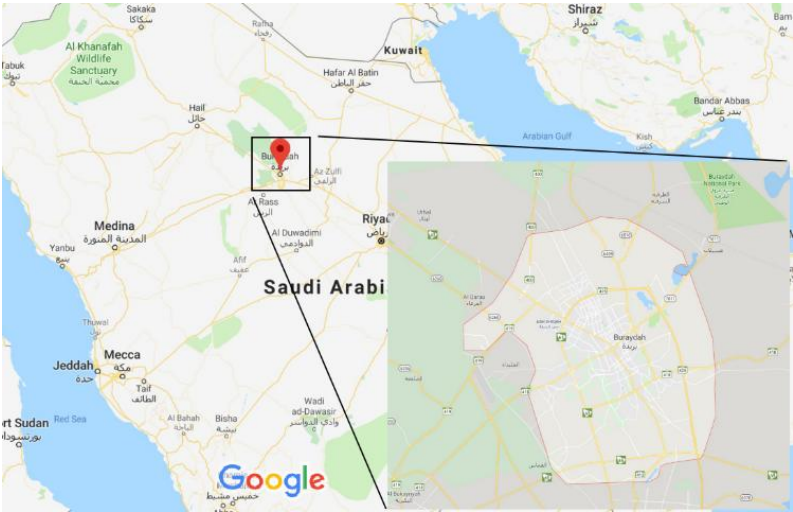 Figure (1): Location of Buraydah City in central Saudi Arabia
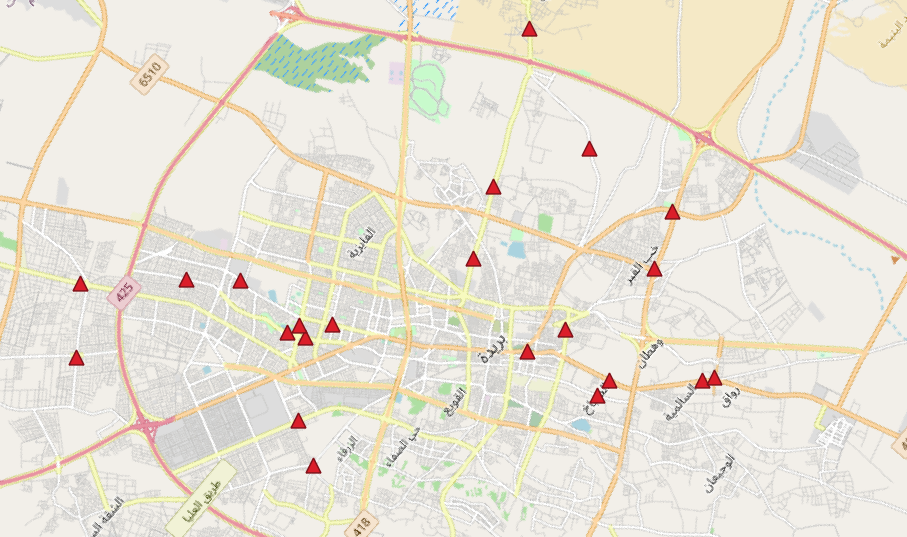
Figure (2): The selected work zones in Buraydah City
2.2 Data Collection #
Data collection represents a critical component of this study, encompassing work zone characteristics, traffic data such as Average Daily Traffic (ADT), and vehicle emissions within the work zone. The ADT during peak hours was determined using three possible approaches: traffic maps (e.g., Google Cloud), Decision Tree Methods, and the Bayes Method. In this study, Google Maps was employed to identify peak hours in Buraydah City, which typically occur between 7:00 PM and 10:00 PM. Following the identification of peak periods, ADT was recorded at each work zone to count the number of passing vehicles and trucks.
Air pollutant concentrations were measured using a Portable Emissions Measurement System (PEMS), capable of detecting carbon monoxide, hydrogen sulfide, nitrogen dioxide, ozone, particulate matter, sulfur dioxide, volatile organic compounds, and other pollutants. Figure 3 depicts a team member conducting emission measurements at one of the work zones using the PEMS device
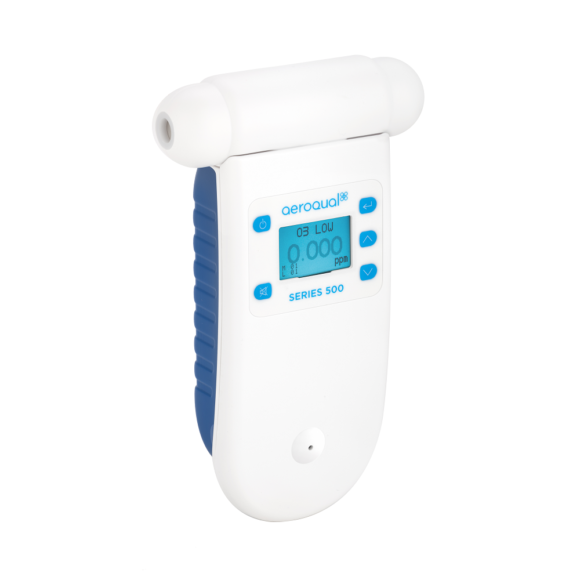

Figure (3): Emission measurement using PEMS at a work zone.
2.3 Vehicles Speed #
Vehicle speed plays a critical role in determining emission levels within work zones. Extremely low speeds, often resulting from congestion or frequent stops, tend to increase emissions of carbon monoxide (CO), hydrocarbons (HC), and carbon dioxide (CO₂). The average speed of vehicles passing through the work zone was measured using the instrument shown in Figure 4.
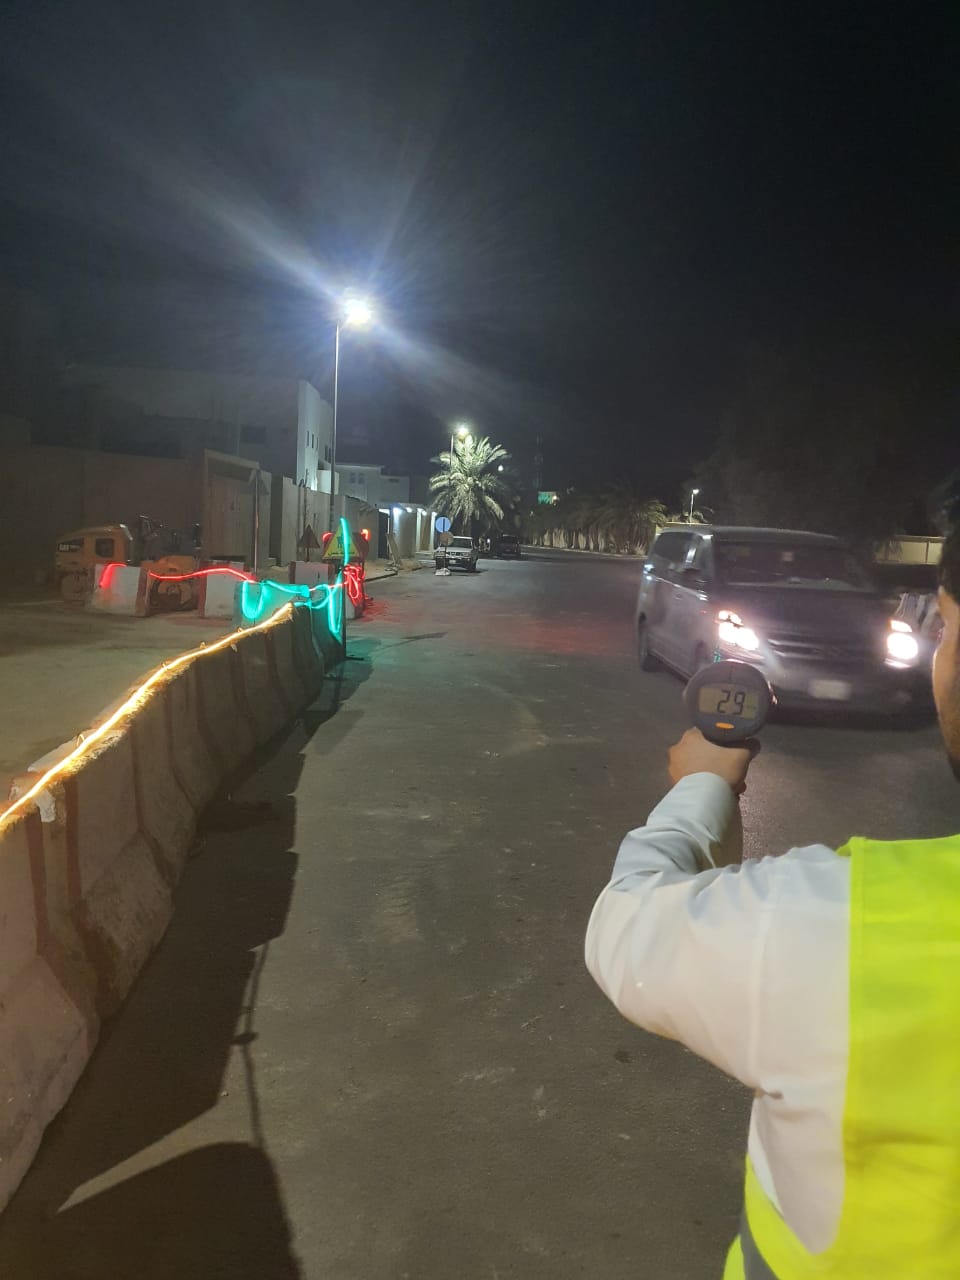

Figure (4): Instrument used to measure vehicle speed at work zone
2.4 Work Zone Length. #
The length of a work zone has a direct and measurable impact on vehicle emissions, particularly during peak traffic hours when congestion is most severe. Longer work zones can lead to extended periods of vehicle idling, frequent acceleration and deceleration, and slower average speeds, all of which contribute to higher emissions of pollutants such as carbon monoxide (CO), hydrocarbons (HC), nitrogen oxides (NOₓ), and particulate matter (PM). In this study, the length of each work zone was carefully measured using a measuring wheel, as shown in Figure 4. Accurate measurement of work zone length is essential not only for assessing traffic flow and congestion patterns but also for correlating these factors with emission levels, enabling a more precise evaluation of the environmental impact of construction activities on surrounding areas.
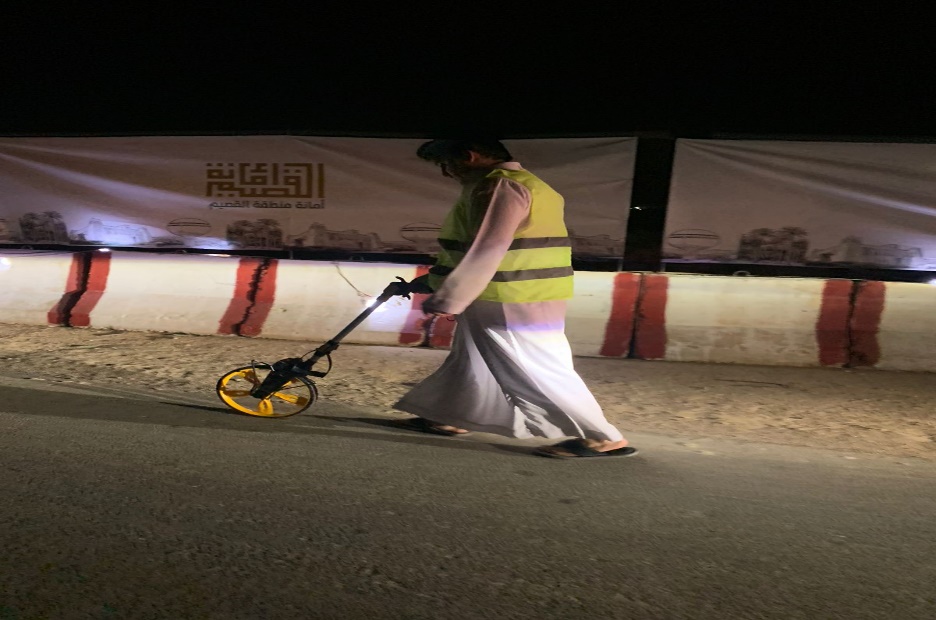
Figure (5): Measuring work zone length using a measuring wheel
2.5 Air Quality Index #
Following the measurement of vehicle emissions within or around a work zone, the Air Quality Index (AQI) is the most suitable metric for assessing the impact on ambient air quality. Developed by the U.S. Environmental Protection Agency (EPA), the AQI is widely adopted internationally and is particularly effective for evaluating the environmental effects of localized sources such as road work zones. The index emphasizes six key pollutants, as summarized in Table 1:
Table 1: Major pollutants in the AQI and their air quality categories
O3 (ppm) | PM10 (ppm) | PM2.5 (ppm) | CO (ppm) | SO2 (ppm) | NO2 (ppm) | CO2 (ppm) | AQI Values | Level of Health Concern |
0.000 – 0.059 | 0 – 0.054 | 0.0 – 0.0154 | 0.0 – 4.4 | 0.000– 0.034 | – | 0-700 | 0 – 50 | Good |
0.060 –0.075 | 0.05–0.154 | 0.0155– 0.0404 | 4.5 – 9.4 | 0.035– 0.144 | – | 701-1000 | 51 – 100 | Moderate |
0.076 –0.095 | 0.155– 0.254 | 0.0405– 0.0654 | 9.5 –12.4 | 0.145– 0.224 | – | 1001-1500 | 101 – 150 | Unhealthy for Sensitive Groups |
0.096 –0.115 | 255– 354 | 65.5 – 150.4 | 12.5–15.4 | 0.225– 0.304 | – | 1501-2500 | 151 – 200 | Unhealthy |
0.116 –0.374 | 355– 424 | 150.5– 250.4 | 15.5–30.4 | 0.305– 0.604 | 0.65–1.24 | 2501-5000 | 201 – 300 | Very Unhealthy |
– | 0.255– 0.354 | 0.0655– 0.1504 | 30.5–40.4 | 0.605– 0.804 | 1.25–1.64 | >5000 | 301 – 400 | Hazardous |
– | 0.355– 0.424 | 0.1505– 0.2504 | 40.5–50.4 | 0.805 – 1.004 | 1.65–2.04 | – | 401 – 500 | Hazardous |
2.6 Integrating the Digital Twin-based air quality monitoring approach #
Building on the collected data, this study develops a Digital Twin (DT) framework that incorporates real-time air quality monitoring within work zones.
2.6.1 Data collection:
A multi-source data acquisition strategy is adopted, including:
a- Road Asset and Traffic Data
- Road Geometry and pavement conditions.
- Real-time traffic data, including vehicle type, count, and speed.
b- Work Zone Activity Logs
- Construction equipment usage, engine type, operation durations.
- Work Zone location, size, and time schedules.
c- Air Quality and Metrological Data
- Fixed and mobile air quality sensors to monitor pollutants.
- Weather stations to measure temperature, humidity, and wind speed/direction.
2.6.2 A multi -layered Digital Twin is created using Building Information Management (BIM) and Geographic Information System (GIS) integration as shown in the Figure 6. The Digital Twin includes:
a- Geometric and Asset Layer
- 3D spatial model of road segments and work zones.
- Asset condition overlaid from pavement management system.
b- Environmental Layer
- Real-time air quality sensor feeds integrated with spatial locations.
- Dispersion modeling to simulate pollutant spread.
c- Traffic Simulation Layer
- Simulation of vehicle movement through work zones (e.g., using VISSIM or SUMO).
- Scenario to model queue formation, idling, and emissions under various traffic control stratifies.

Figure (6): Multi-layered Digital Twin framework for work zone air quality monitoring
3. Results and Discussion #
Figure 7 illustrates the relationship between Average Daily Traffic (ADT) levels and the corresponding Air Quality condition across multiple road work zones. The results demonstrate a nonlinear trend in pollution impact, with air quality categories ranging from the “Good” to ” Unhealthy for Sensitive Groups,” based on measured pollutant concentrations. Notably, work zones with an ADT of 400 vehicles per day exhibited the highest number of zones with degraded air quality, with the majority falling within the “Moderate” category and at least one zone classified as “Unhealthy.” This indicates that moderate traffic levels may create critical conditions where both vehicular emissions and construction activity contribute significantly to pollution, potentially due to congestion and prolonged idling. In contrast, work zones with very low (200 ADT) or high (1000 ADT) traffic volumes showed a greater proportion of “Good” or “Moderate” air quality, suggesting that lower traffic reduces emissions, while higher traffic may be associated with better traffic flow. These findings underscore the importance of adaptive traffic and work zone management strategies, particularly in moderate-traffic corridors, to mitigate air quality deterioration during maintenance operations.

Figure (7): ADT versus air quality across work zones.
Figure 8 compares the posted speed limits with the actual average travel speeds observed across 40 work zones. As depicted, the posted speeds remain relatively consistent across zones, typically ranging between 80 and 120 km/h. In contrast, the average speeds of the vehicles passing through the work zones are significantly lower in nearly all cases, often falling below 60 km/h and in some cases below 30 km/h. This consistent discrepancy suggests that drivers tend to reduce their speed substantially when passing through work zones, regardless of the officially posted limits. Factors contributing to this behavior may include lane narrowing, construction activity visibility, traffic congestion, and driver perception of risk. From a traffic management perspective, the reduced average speeds may lead to increased emissions due to prolonged idling and stop-and-go conditions, especially in zones where speed drops below 40 km/h. Furthermore, the mismatch between posted and actual speeds indicates potential opportunities for dynamic speed regulation and improved signage to align speed expectations with actual driving behavior. These findings support the integration of speed-related parameters in Digital Twin models to improve traffic flow simulation and environmental impact forecasting in work zone scenarios.
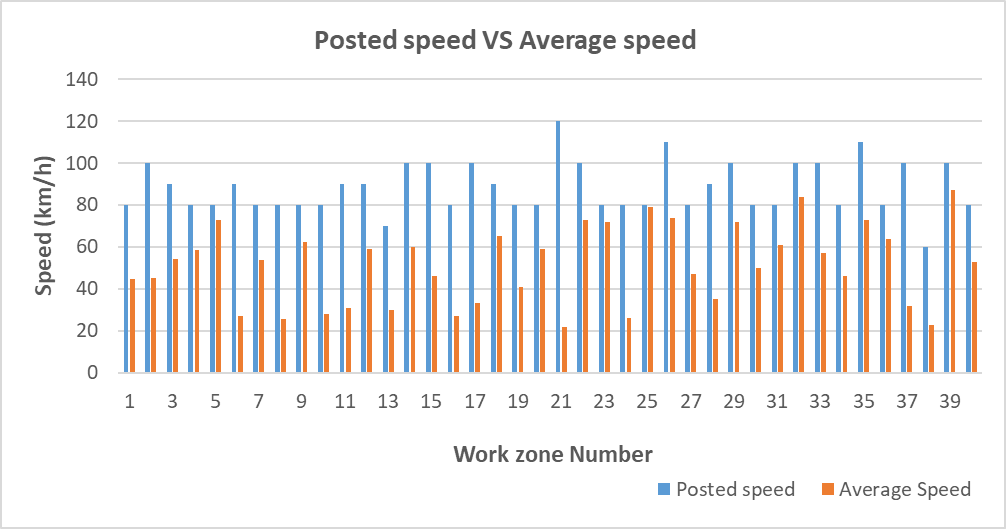
Figure (8): Posted speed limits vs. observed average speeds in 40 work zones
Figure 9 illustrates the relationship between the length of work zones (in meters) and the corresponding air quality classification observed across multiple sites. The color-coded bars represent air quality categories, which are ranging from Good (green), Moderate (yellow), and Unhealthy (red), based on pollutant concentrations measured during construction activities. The shorter work zones, particularly those between 100 to 200 meters, are associated with the highest frequency of moderate air quality levels, with several zones recording over 10 occurrences in this range. One zone in the 200–300 m category recorded unhealthy air quality, indicating that compact zones with dense activity and restricted airflow may contribute to localized pollution spikes. As the work zone length increases to 500–1000 meters, the number of zones with moderate air quality decreases, with no zones classified as unhealthy or hazardous for sensitive groups. This trend suggests that longer work zones may allow for better dispersion of emissions and reduced concentration of pollutants per unit area, despite potentially higher total emissions. These findings highlight the importance of incorporating work zone geometry into digital twin simulations and air quality modeling frameworks to more accurately predict environmental impacts and inform mitigation strategies.
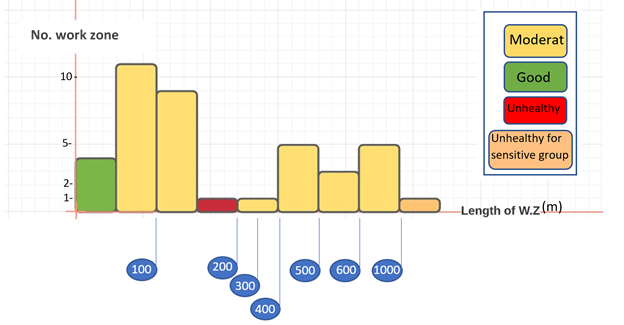
Figure (9): Relationship between work zone length and air quality classification.
For the 40 work zones examined in this study, air quality classification based on pollutant levels revealed significant variation in health-related exposure. Out of the total sites, only 4 work zones (10%) were classified as having “Good” air quality, indicating minimal environmental or health concerns. A majority of zones, 34 sites (85%), fell under the “Moderate” category, suggesting that while pollutant levels were within acceptable limits, they may still pose concerns for vulnerable populations or under prolonged exposure. Additionally, 1 work zone (2.5%) was categorized as “Unhealthy for Sensitive Groups”, including individuals with respiratory or cardiovascular conditions, the elderly, and children. Finally, 1 work zone (2.5%) exceeded threshold limits to the extent that it was classified as “Unhealthy” for the general population, highlighting the potential severity of emissions under certain work zone configurations or operational conditions. These results confirm the importance of incorporating environmental performance metrics into road asset and construction management strategies to protect public health.
3.1 Multiple Regression Analysis #
In order to investigate the relationship between a single dependent variable and multiple independent variables, multiple regression is a statistical modeling technique that allows the prediction of an outcome variable based on the known values of multiple predictors, each of which is given a weight that represents its unique influence. The regression model’s general form is as follows:
 (1)
(1)
where Y denotes the dependent variable, X₁ to Xₙ are the independent variables, and a, b₁, …, bₙ are the regression coefficients estimated through the least squares method to minimize prediction error.
Based on the operational and physical features of road work zones, a multiple linear regression model was created in this study to predict carbon dioxide (CO₂) emissions, a crucial environmental indicator. Three independent variables are included in the model: average daily traffic (ADT), the length of the work zone (L) in meters, and a binary indicator that indicates if an intersection is present (I). The following provides the final predictive model:
 (2)
(2)
The focus on CO₂ emissions is justified by the fact that it is a significant greenhouse gas associated with climate change and that it is directly related to both construction and vehicle activities. Road work zones sometimes involve idling, rerouting, traffic congestion, and the use of fuel-powered equipment, all of which raise CO₂ levels. Through the prediction of emissions under various scenarios, this model offers important information about how well work zones function environmentally.
The analysis was conducted by using the Microsoft Excel’s linear regression analysis tool, a predictive model developed to estimate CO2 emissions based on selected independent variables related to work zone characteristics. The model results are summarized in Table 2.
Table 2: Regression analysis summary for CO₂ emissions
Multiple R | 0.665 |
R Square (R2) | 0.442 |
Adjusted R Square | 0.366 |
Standard Error | 33.18 |
Number of Observations | 26 |
The R² value of 0.442 indicates that approximately 44.2% of the variation in CO₂ emissions can be explained by the selected independent variables: work zone length, average daily traffic (ADT), and the presence of intersections. While this level of explanatory power is moderate, it is considered acceptable given the variability often present in environmental and transportation data. The adjusted R² of 0.366 accounts for the number of predictors used and confirms the model’s adequacy without overfitting.
In Table 3, the regression coefficients of the independent variables are presented. These coefficients represent the magnitude and direction of the relationship between each variable and the predicted CO₂ emissions. A positive coefficient indicates a direct relationship with CO₂ output, while a negative coefficient suggests an inverse effect.
 Table 3: Regression coefficients for CO₂ emission predictors
Based on the developed regression model, the following relationships can be identified between carbon dioxide (CO₂) emissions and the key influencing variables. Figure 10 illustrates the direct relationship between CO₂ emissions and the length of the work zone, under controlled conditions where the average daily traffic (ADT) is fixed at 500 vehicles/day, and no intersection is present within the work zone. The graph clearly shows that as the length of the work zone increases, the predicted CO₂ emissions also increase in a linear pattern, confirming the positive coefficient obtained for the length variable in the regression analysis.
This trend is consistent with the physical understanding that longer work zones tend to require more time for vehicles to traverse, often involving reduced speeds, prolonged idling, and acceleration/deceleration cycles, all of which contribute to higher fuel consumption and increased emission levels. Therefore, the length of the work zone emerges as a critical geometric factor in emission modeling, particularly for short-term maintenance zones in urban or peri-urban environments.
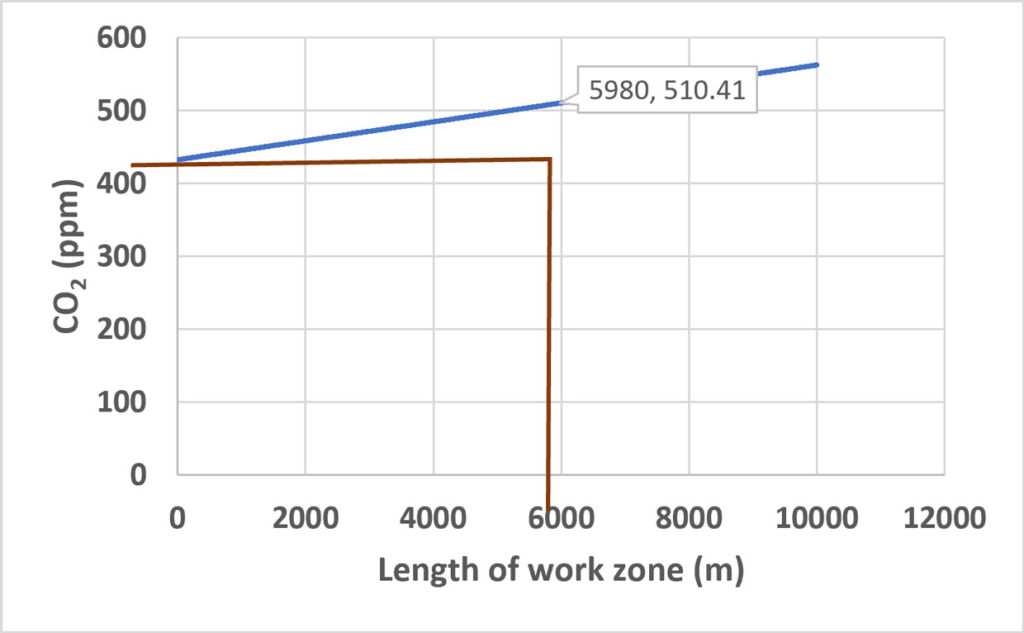
Figure (10): CO₂ emissions vs. work zone length at ADT of 500 vehicles/day
Assuming that the work zone is 100 meters long and devoid of intersections, Figure 11 shows the linear relationship between carbon dioxide (CO₂) emissions and average daily traffic (ADT). According to the chart, there is a definite positive association between rising traffic numbers and rising CO2 emissions. Since more vehicles moving through a restricted work zone generate more cumulative emissions as a result of repeated acceleration, deceleration, idling, and traffic delays, this relationship is consistent with expected traffic emission behavior.
The traffic volume is a crucial predictor in emission modeling, as the graphic illustrates. The localized air quality is significantly impacted by a daily increase in the number of vehicles, even with a small work zone length. These results corroborate the outputs of the regression model and provide attention to the need for traffic load characteristics to be included in predictive environmental assessments for the planning of road repair. This knowledge is especially helpful for maximizing temporary traffic control plans to reduce environmental effects while construction or maintenance is underway.
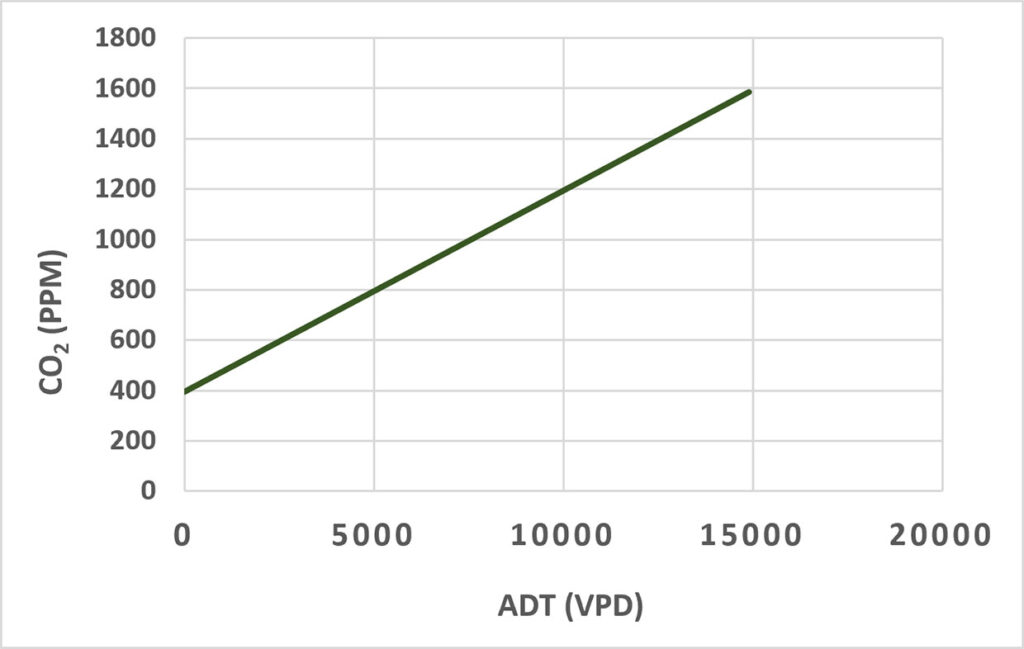
Figure (11): CO₂ emissions vs. ADT for a 100 m work zone
The effect of an intersection on carbon dioxide (CO₂) emissions is depicted in Figure 12 when the average daily traffic (ADT) fluctuates and the work zone length is set at 100 meters. The figure illustrates how the existence of intersections has a negative impact on CO₂ levels, as shown by the regression model’s negative coefficient for the intersection variable (see Table 3). This implies that work zones without intersections typically generate higher CO₂ emissions than those with intersections, even after adjusting for work zone length and ADT.
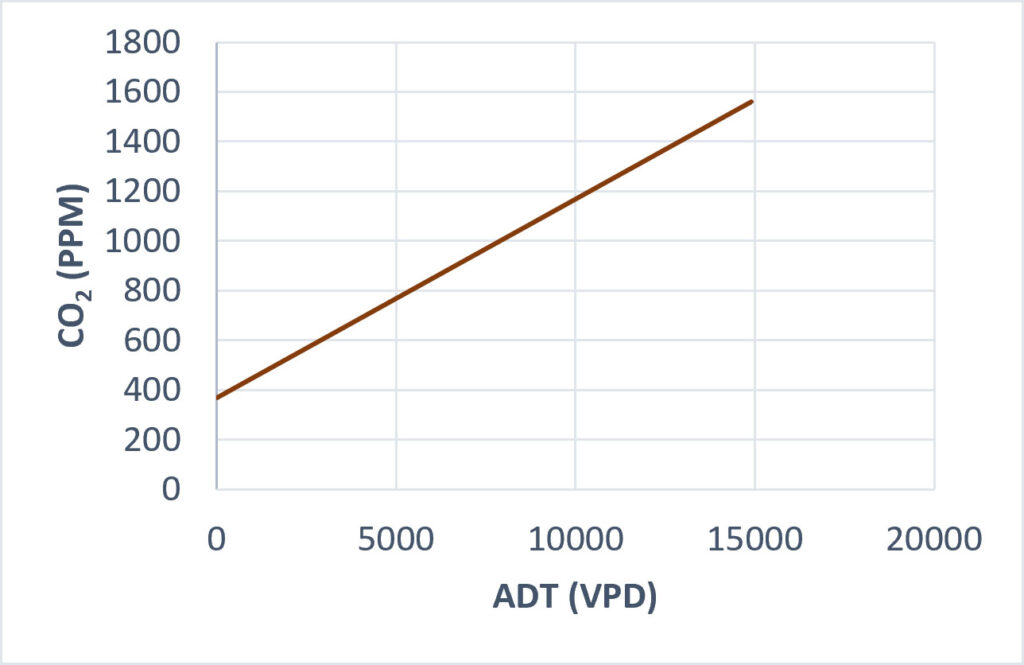
Figure (12): Impact of intersections on CO₂ emissions
3.3 Leveraging Digital Twins to Manage Emissions in Road Work Zones #
Particularly in cities with heavy traffic, work zones frequently result in localized environmental and traffic-related problems. The increased emissions of pollutants such carbon dioxide (CO₂), nitrogen oxides (NOₓ), and particulate matter (PM) as a result of lane closures, speed adjustments, queuing, and intersection effects are one of the main causes for concern. Incorporating Digital Twin (DT) technology into work zone planning offers a revolutionary way to track, forecast, and manage these effects in real time, which is in line with the growing interest in sustainable road asset management.
3.3.1: Contribution of Digital Twins in Work Zone Emissions Control
3.3.1.1: Real-Time Monitoring:
DTs can integrate data from IoT-enabled air quality sensors, traffic counters, and CCTV cameras to monitor real-time emissions and traffic behavior. This enables detection of emission hotspots and deviations from acceptable thresholds during construction.
3.3.1.2: Predictive Modeling
Using historical data and statistical algorithms, the DT simulates future traffic scenarios and predicts emissions based on changes in lane configuration, vehicle flow, weather, and work zone duration.
3.3.1.3: Environmental Parameters
Environmental parameters such as wind speed and direction, temperature, and solar radiation are critical for understanding how pollutants move and concentrate. Including these variables enhances decision-making around work zone duration, timing, and placement.
3.3.1.3: Responsive Traffic Management
The Digital Twin can initiate dynamic traffic control techniques, such as rerouting algorithms that reroute traffic through lower-emission corridors and variable message signs (VMS), which provide drivers with real-time route suggestions if emissions above safe criteria.
• Modifications to speed limits to lower emissions from acceleration-deceleration cycles.
• Retiming of traffic signals to relieve congestion close to the impacted work zone
• Temporary or partial lane closures or work rescheduling according to the impact predictions.
The DT is changed from a passive monitoring tool to an active traffic and emissions control system by this proactive reaction capability.
4.3.2: Suggested Framework for Digital Twin-Driven Emission and Traffic Management
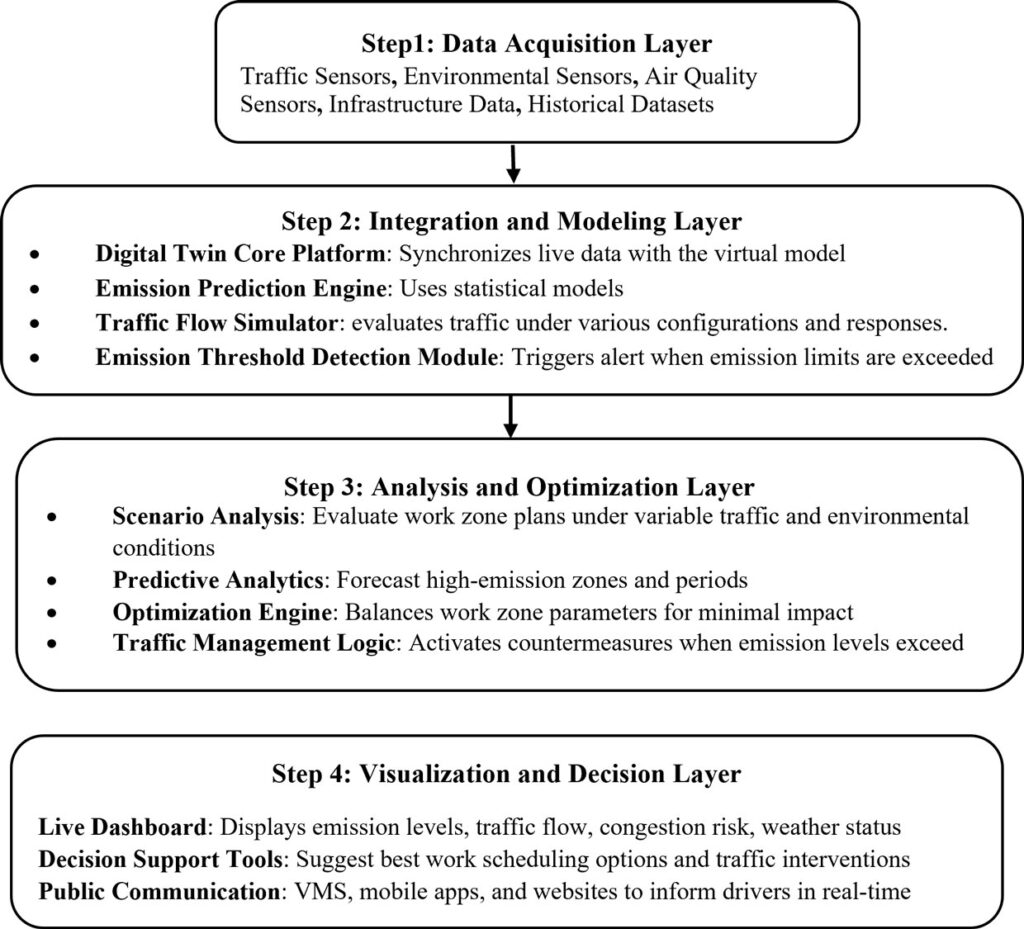
Figure (13): Suggested framework for DT of Controlling Emission at Work Zones
4.3.3 Suggestions and Recommendations
To enhance the quality, accuracy, and applicability of future studies in this area, the following recommendations are proposed:
- Expand Data Collection Scope: To increase statistical reliability and the generalizability of results, future studies should focus on gathering a bigger and more varied dataset.
- Incorporate Additional Variables: To properly account for their impact on emissions and traffic flow characteristics, future models should incorporate geometric and environmental elements like: Lane width, Shoulder width, ambient temperature during data collection, Relative humidity, Seasonal fluctuations.
- Improve ADT Estimation Methods: Improving model precision requires using more precise and standardized techniques to estimate Average Daily Traffic, particularly in places without historical traffic data.
- Promote Local Research on Traffic Emissions: More thorough studies on air pollution caused by traffic are needed in Saudi Arabia, especially in relation to development zones and urban infrastructure projects.
Further study will be in a better position to offer more precise insights on work zone emissions and traffic behavior by resolving these shortcomings and putting the following recommendations into practice. Additionally, incorporating Digital Twin technologies can facilitate proactive decision-making by enabling real-time monitoring, simulation, and predictive modeling of the effects of traffic and air quality. In the end, this method contributes to smarter and more resilient infrastructure systems by improving the accuracy of environmental evaluations and assisting in the creation of sustainable transportation plans and well-informed urban planning.
5. Conclusion #
This study emphasizes how important road construction work zones are in affecting local air quality and how crucial it is to incorporate cutting-edge modeling and monitoring techniques to lessen their negative environmental effects. The results show that the length of the work zone, average daily traffic, and vehicle speed all have significant effects on the emissions of important pollutants like CO₂, PM₂, and NO₂. The necessity for real-time and predictive assessment methods is highlighted by the inadequacy of traditional static air quality models in capturing the dynamic conditions within work zones.
This research offers a comprehensive approach for continuously monitoring and simulating environmental conditions, traffic behavior, and work zone operations by putting forth a Digital Twin (DT)–based framework. Proactive decision-making for work zone design, emission mitigation strategies, and traffic management is made possible by the DT framework’s ability to integrate real-time data from weather, air quality monitoring equipment, and traffic sensors. In addition to supporting data-informed design for sustainable urban transportation systems, this method improves the accuracy of emission estimates.
Overall, integrating Digital Twin technology into work zone environmental management is a viable solution to accomplish Saudi Vision 2030’s goals, especially those related to digital transformation, sustainability, and the creation of smart cities. To further lessen the environmental impact of road infrastructure projects and guarantee safer and healthier urban settings, future research should keep improving DT models, integrate more operational and environmental factors, and investigate adaptive control techniques.
6. References
Alharbi, B., Shareef, M., & Husain, T. (2015). Study of chemical characteristics of particulate matter concentrations in Riyadh, Saudi Arabia. Atmospheric Pollution Research, pp. 88-98.
Alnagran, H., Mansour, H., Alashrah, S., Suardi, N., & Abdul Rahman, A. (2023, Augusts 28). Evaluation of Toxic Heavy Metalsand Health Riskin Airborne Particulate Matter at Qassim region, Saudi Arabia. Trends in Sciences.
Digital Goverment Authority. (2021). Digital Twin. Riyadh. Retrieved from https://dga.gov.sa/sites/default/files/2022-08/Digital%20Twin.pdf
Font, A., Baker, T., Mudway,, I., Purdie, E., Dunster, C., & Fuller, G. (2014). Degradation in urban air quality from construction activity and increased traffic arising from a road widening scheme. Science of the Total Environment, pp. 497-498.
Ramadan, M., Ali, M., Khoo, S., Alkhedher, M., & Alherbawi, M. (2024, September). Real-time IoT-powered AI system for monitoring and forecasting of air pollution in industrial environment. Ecotoxicology and Environmental Safety, p. 283.
Vision 2030. (2016). Saudi Vision 2030.
WHO. (2023). Environmental Health Saudi Arabia 2023 country profile. World Health Organization. Retrieved from https://cdn.who.int/media/docs/default-source/country-profiles/environmental-health/environmental-health-sau-2023.pdf?sfvrsn=2669fc86_2&download=true
WHO. (2025, August ). Air Pollution . Retrieved from World Health Organization : https://www.who.int/health-topics/air-pollution#tab=tab_2
Yan, B., Yang, F., Qiu, S., Wang, J., Cai, B., Wang, S., . . . Hu, W. (2023). Digital twin in transportation infrastructure management: a systematic review. Intelligent Transportation Infrastructure, pp. 24, liad024.


