


Jaroslaw Gil PhD, MIOA, MIDiagE & Chris Gilbert MIOA, FIDiagE

Rotating Equipment Verification Equipment Ltd, United Kingdom Jarek@aapb.co.uk, Chris@aapb.co.uk & info@r-e-v.co.uk
Abstract #
Vibration condition monitoring and data management in a modern waste recovery park conjures up images of pages and pages of datasheets, with hundreds of measurement locations and millions of data points. This paper aims to prove that the whole process can be simplified and operated as a practical, cost effective solution without overcomplicating or overprotecting machinery, whilst ensuring the plant is maintained in an effective manner. Moreover, using the strategies and methodologies adopted; including targeted vibration monitoring, high resolution data analysis and concise data management techniques ensures lengthy and expensive breakdowns are minimised.
Keywords: Vibration, Rotating, Maintenance
1 Introduction #
A large state-of-the-art waste recovery plant in the United Kingdom combines waste recycling with renewable energy generation. The plant includes a mechanical treatment facility for waste recycling, an anaerobic digestor and Combined Heat and Power generators (CHP) for energy from biodegradable waste and an Advanced Thermal Treatment facility that uses non-recyclable and non-compostable waste as fuel to heat steam and power an 8 MW turbine. The plant has over 250 machines with rotating parts (motors, pumps and fans) that require constant monitoring. Vibration condition monitoring is a non-invasive technique of monitoring the condition of the machines and identifying faults before they become failures. However, the large amount of measurement data requires significant data management skills. Rotating Equipment Verification Limited (REV) have carried out baseline measurements of the equipment, set up a management scheme and provided training to the employees of the waste recovery park so that they can continue carrying out periodic monitoring. The potential of identifying faults before they cause failures and therefore, potentially a complete plant shutdown, leads to massive savings for the waste recovery site operator.
The initial baseline measurements incorporated a significant amount of data, culminating in the output from the measurement software [5] which had up to thirteen graphs per measurement location, including ISO spectra, g- spectra, separate spectra for displacement, unbalance, misalignment and looseness, time waveform, trend line for ISO, BDU and g. Multiplied by three measurement directions per machine and by all machines, this gives an unmanageable amount of data. Expert knowledge was required to carry out data selection and export only data that was relevant to the vibration pattern of the machine. The summary report of pre-selected data still ran into a three hundred and thirty four page report – see Appendix 1 showing an excerpt of one of the many summary tables.
2 Vibration condition monitoring #
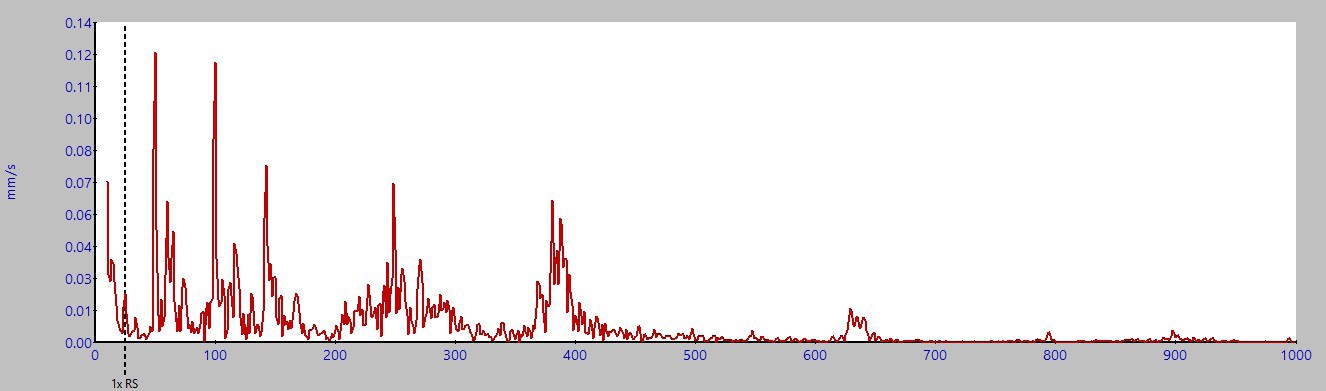
Vibration monitoring is an non-invasive method of checking machine condition. An ideal machine has smooth rotation with the centre of mass of the rotating element located exactly at the centre of gravity. In that case there would be minimum or no vibration levels recorded. In reality, there is always some degree of unbalance, which causes vibration at a frequency corresponding to the rotational speed. Vibration levels depend on the magnitude of the exciting force, and the mass, stiffness and damping of the elements. A machine in excellent condition will show very low vibration levels (< 1 mm/s rms). The frequency spectrum will either show broad band low- amplitude noise floor or a single peak at the rotational frequency – see examples below:
a)
mm/s
b)
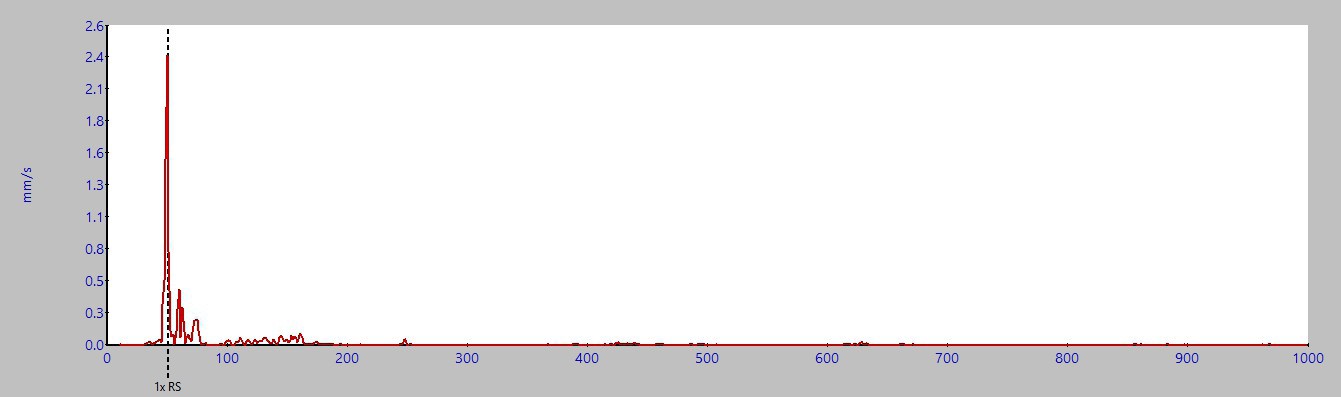
Figure 1 – Two spectra graphs of machines in good condition displaying: a) low amplitude noise floor across the frequencies, b) single peak at rotational speed without harmonics
Damage and wear and tear of the machine will inevitably cause an increase in vibration levels. However, only measuring the magnitude of vibration can be inconclusive, unless the measurements are regularly repeated and a trend line is plotted to show how the magnitude increases over time. Another useful tool is FFT (fast-fourier transform) analysis [4], which allows us to look at the frequency spectrum (examples shown in Figure 2). A large peak at the fundamental frequency may indicate unbalance. Visible harmonics may indicate different problems, e.g. misalignment at 2 x F0, looseness at multiple higher harmonics. Gear mesh, bearing or fan blade problems can cause vibrations at much higher frequencies (> 1000 Hz) [3 &4], dependent on numbers of teeth, numbers of balls/rollers or number of fan blades for example.
The graph below shows a spectrum with clearly visible harmonics up to 5 x F. Although the overall velocity levels are low, the spectrum indicates likely looseness, which could lead to increased vibration in the future (growing trend line), which would increase looseness and can lead to eventual failure.
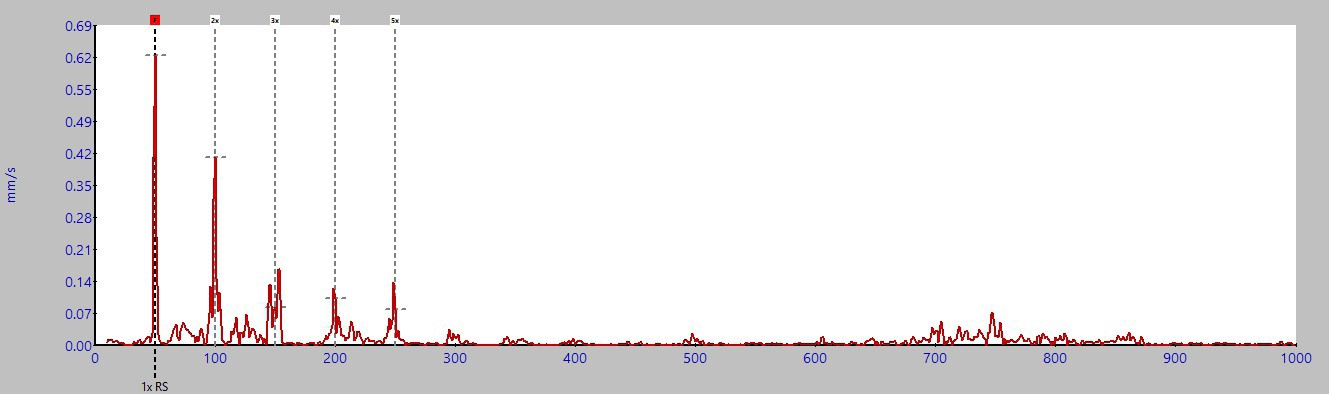
Figure 2 – Spectrum of a pump motor vibration with clearly visible harmonics.
Faults can be detected using a combination of the following methods:
- Comparison of overall levels to industrial standards (ISO 10816-3);
- Comparison with previous measurements (trend line analysis);
- Spectrum analysis;
- Time waveform analysis;
- Phase analysis.
With the exception of phase analysis, the instrumentation used on this project, a TPI 9080 Pro meter and VibTrend software [5], allowed the use of the above methods.
ISO 10816-3 [2] is the current standard for the evaluation of “standard” rotating machine operating condition. Issued in 2009 it covers “large and medium size industrial machines with nominal power rating above 15 kW and nominal speeds between 120 rpm and 15000 rpm”. In addition, pumps are added
as a specific category for consideration. This range covers most rotating machines and can therefore be used as a good guide for in-situ operating conditions. The chart below illustrates the standard and allows a quick comparison of actual against standard operating condition. Variations will inevitably occur when comparing these standards to actual machine operating conditions. Machines should not however be condemned because of variations in readings without first considering other potential reasons for the difference in readings. The values in the chart are therefore used as guidelines, but are used in combination with spectrum analysis and trendlines to determine the condition of a machine.
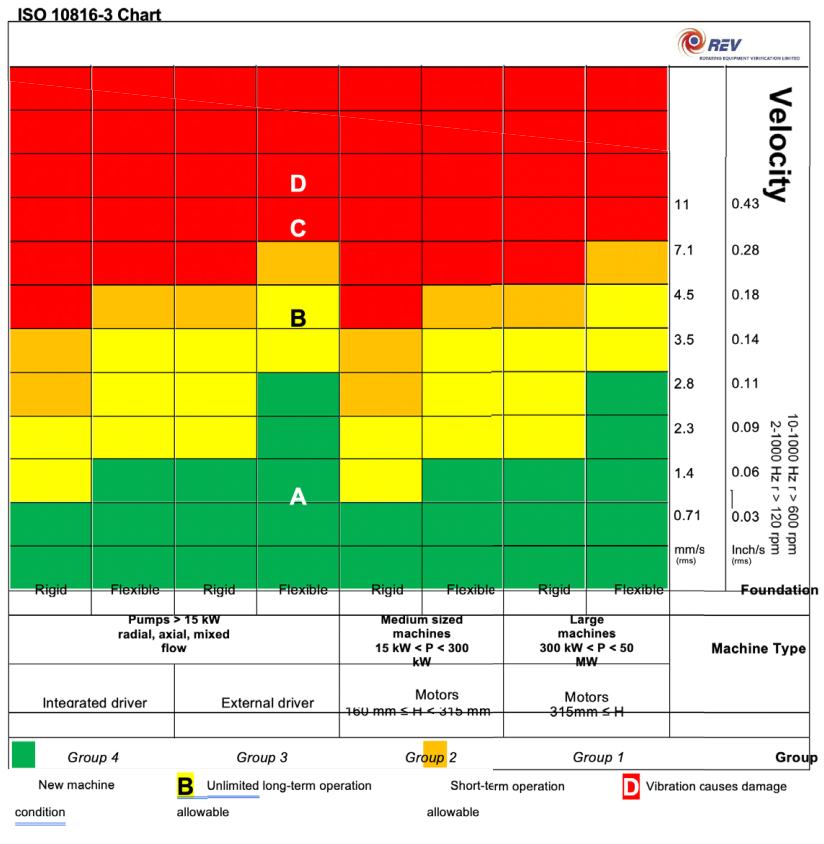 Figure 3 – ISO 10816-3 chart
3 Definitions #
Vibration – Repeated oscillating movement in alternating directions.
Amplitude – Magnitude of vibration expressed either in terms of the peak value, peak-to- peak or the energy equivalent average called RMS (Root-Mean-Square)
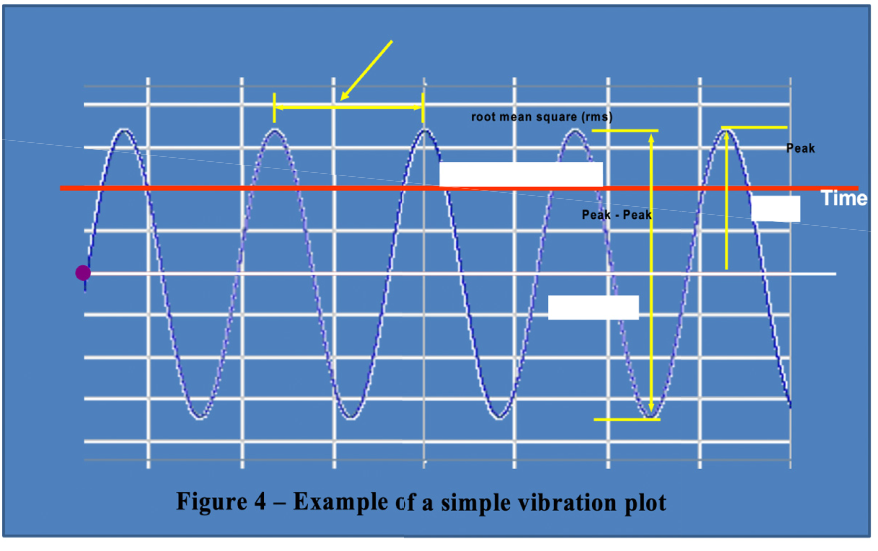 Displacement – Physical movement of the vibrating element measured in millimetres (mm) or mils
(thousandth of an inch). Usually the peak-to-peak displacement is measured.
Velocity – Speed at which displacement occurs. Usually measured in mm/s RMS or inch/ sec RMS. Acceleration – The rate of change of velocity. Usually measured in m/s2 or g values (gravitational
constant)
Frequency – The number of oscillations in a given time. The commonly used unit is Hz, where 1 Hz =
1 oscillation in 1 second. F = rpm / 60 [Hz]
Fundamental frequency – The lowest frequency of vibration, usually corresponding to the rotational speed. If the rotational speed is expressed in rpm (revolutions per minute), then the fundamental frequency, in Hz, can be calculated by dividing the rpm by 60.
Harmonics – Vibrations that occur in frequencies that are multiples of the fundamental frequency, e.g.
2xF, 3xF, etc.
Frequency spectrum – A plot showing vibration levels at different frequencies in a wide range. Useful in condition analysis, as different frequencies can correspond to different types of faults, e.g. unbalance, gear mesh damage, bearing damage, etc.
ISO (mm/s) – Vibration levels expressed as rms velocity in the range of 10-1000Hz, in line with ISO
10816-3:1998
g – Vibration total acceleration (m/s2) expressed in g units (1g = 9.81 m/s2, i.e. Earth gravitational constant).
BDU – ‘Bearing Damage Units’ – vibration units derived from g rms acceleration above
1000 Hz. 100 BDU corresponds to 1g rms above 1kHz. This unit is an indication of likely bearing damage.
4 Methodology #
Measurements were carried out using a single axis accelerometer with a magnetic mounting block. A minimum of three measurements were carried out on a single machine, to get three orthogonal directions: vertical, axial and transverse (see Figure below). This simplified instrumentation approach was adopted to ensure the monitoring could be continued by the client’s own plant operators in the future, therefore more specialised and complicated instrumentation was undesirable.
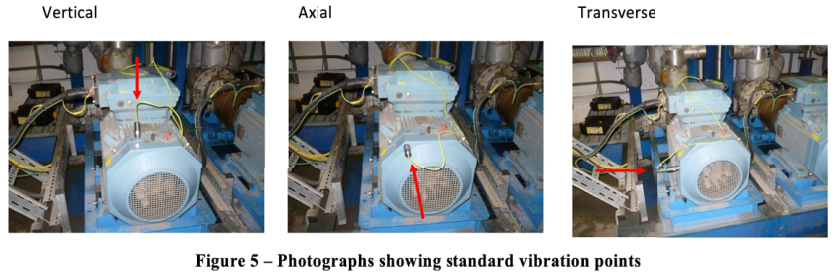 Choosing the measurement location was a challenge. Many of the machines are pumps with integrated motors, therefore different vibration levels will occur on the non-drive end, drive end of the motor, the bearing and on the pump housing. However, with over 250 machines and a scheme for plant operators to carry out regular monitoring themselves, the aim was to streamline the process and choose one common location for most of the machines. For most units, the non-drive end of the motor was the easiest or only accessible location for accelerometer placement (as shown in Figure 5). It is not considered to be the textbook location, but it allowed to have a consistent measurement procedure for all machines. Where vibration (and often noise levels) were high and further investigation was required, then additional measurement points were added on the drive end, bearing and pump.
For each measurement point, a 3-second steady-state RMS velocity and acceleration measurement was recorded. The frequency range of the TPI 9080 meter was 2-10000 Hz. FFT analysis was carried out using VibTrend software [5].
Overall ISO velocity values were used to compare against ISO 10816 [2], however, the limits are used as guidelines only. Comparative analysis, trend lines and FFT analysis were used to determine the condition of the machines.
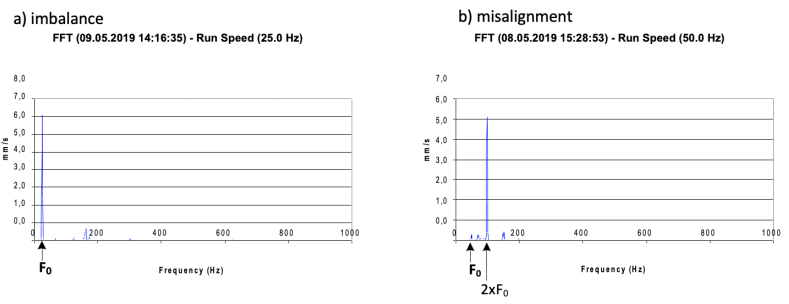
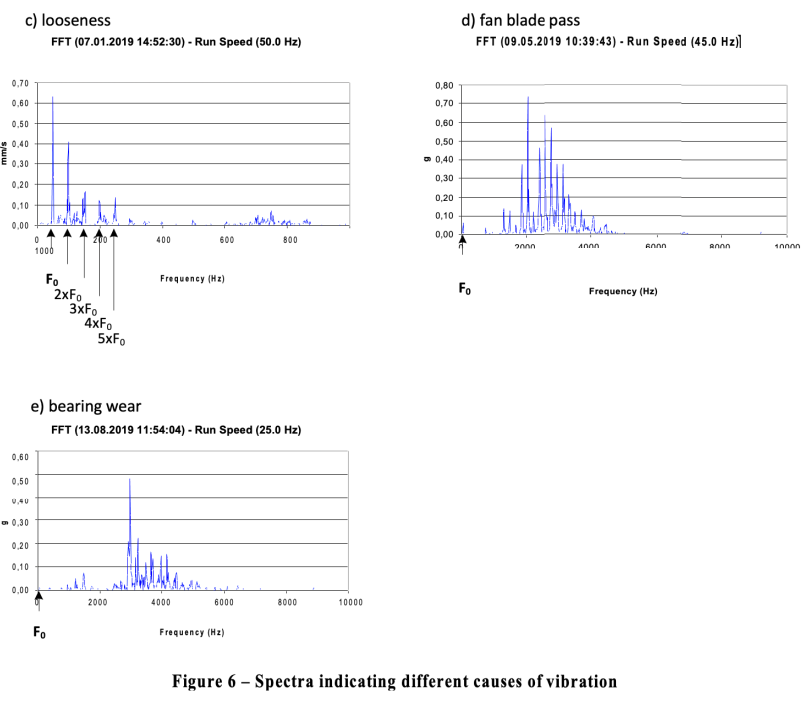
It was important to determine the rotational frequency (RPM) of the motor, as the relation between spectrum peaks and the RPM can give an indication of the likely fault. According to well established industry guidance [1, 3 & 4] the following list shows links between vibration frequency and its likely cause:
- F0 – Imbalance;
- 2 x F0 – Misalignment, bent shaft;
- 3 x F0, 4 x F0, 5 x F0, etc. – looseness;
- High frequency (>1000Hz) – bearing damage, propeller damage, fan blade damage.
Where; F0 – fundamental frequency, Hz – (F0 = RPM ÷ 60).
Examples of spectra indicating likely causes of vibration are shown in Figure 6 below.
The spectra are plotted in terms of velocity (mm/s) for low frequency (10-1000 Hz) and acceleration (g) for high frequency (10-10000 Hz).
5 Results #
Throughout the baseline measurement process, 261 machines were identified and catalogued. 179 were measured. The following is the outcome of the measurements:
- 147 were deemed in good condition. A recommendation to continue periodic monitoring and observe trend lines was given.
- 24 machines had vibration levels that indicated some condition problem. A warning label was given and it was recommended that either measurement is repeated at different locations (e.g. pump or bearing), trend lines are observed or that the unit should be serviced at the earliest opportunity.
- 8 machines had high vibration levels indicating likely failure was imminent. A critical warning level
was given and a recommendation to investigate further and / or service unit was advised.
The practical outcome of the baseline measurement exercise was that a fault was found in two critical machines (thermal oil pump and coolant medium pump) and the units were replaced before they failed and potentially caused a costly shutdown of the plant. One of two bearings on the thermal oil pump was causing high g levels around
3000 Hz. The replaced unit shows negligibly low levels – see Figure 7. The coolant medium pumps required some engineering in addition to replacing the units. They are mounted vertically on a metal support frame – see Figure
8. Such a mounting makes the motor vulnerable to resonant vibration of the support frame, which coincided with the rotational frequency. Therefore, stiffness had to be added to the frame. Measurement results before and after replacement and frame improvement are shown in Figure 9.
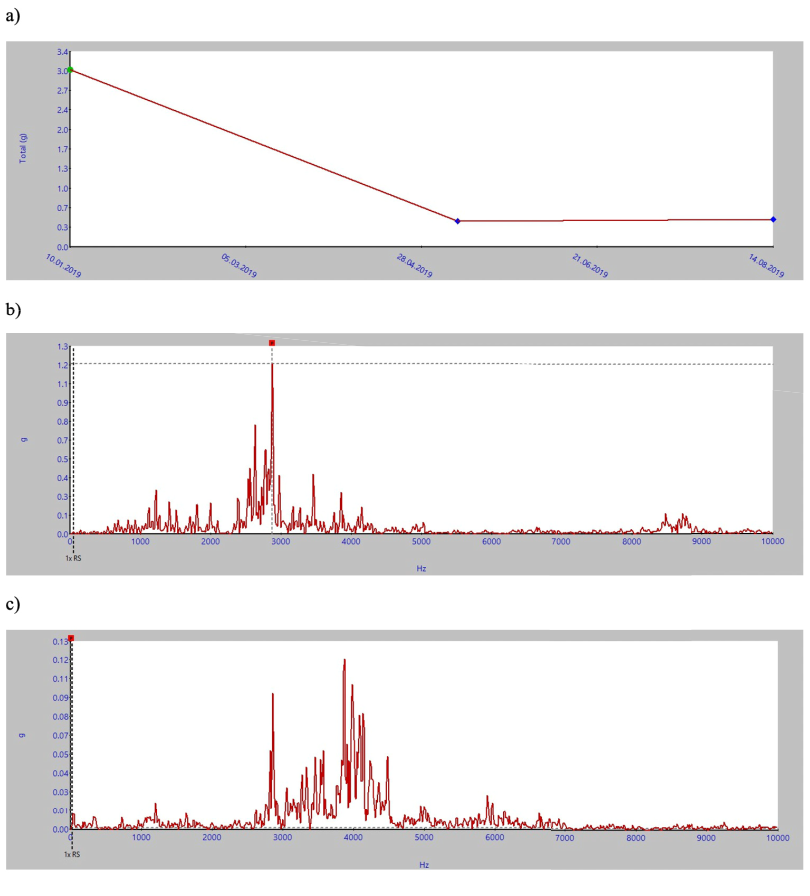
Figure 7 – Acceleration (g) measurement results on a thermal oil pump that was replaced
a) Trend line of g-values – overall vibration dropped from 3.0 g before service to 0.5 g after service b) g spectrum before service – large peak at 2875 Hz indicated problem with one of the bearings.
c) g spectrum after service, on replaced unit – with new bearings, negligible vibration around
0.12 g.
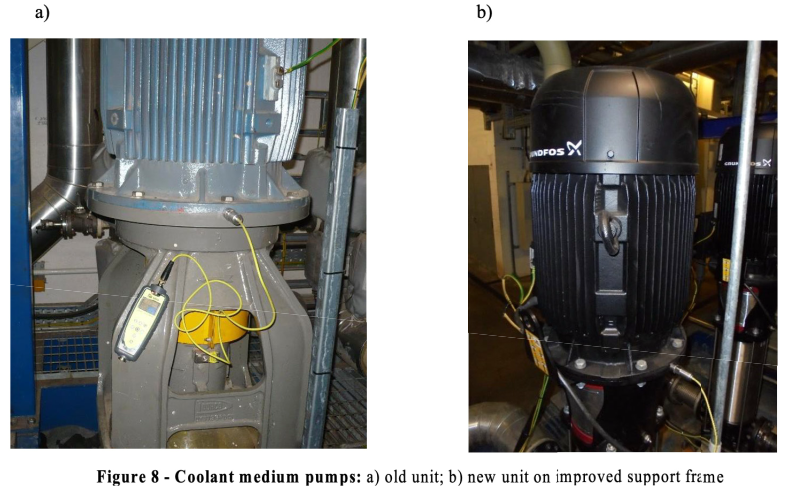
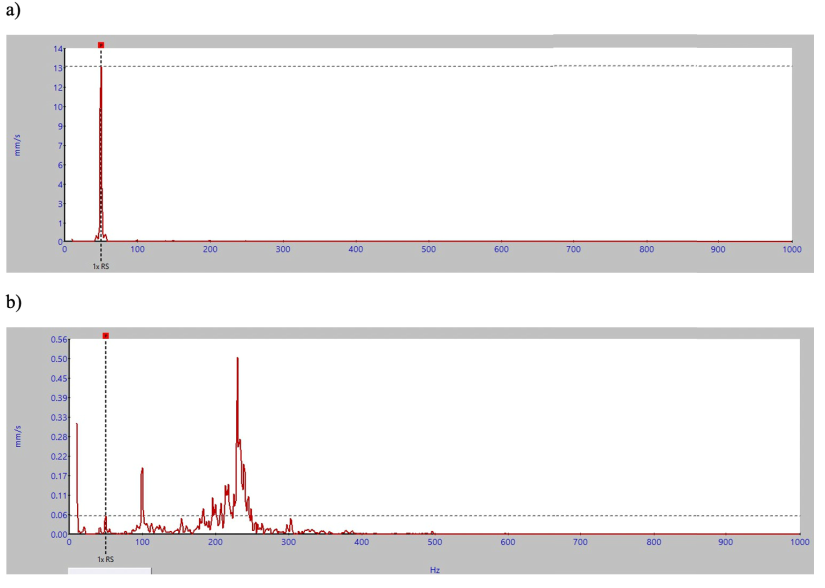 Figure 9 – Velocity spectrum on coolant medium pump motor: a) before service – large peak at rotational frequency indicates unbalance and was caused by resonant vibration of the support structure, coinciding with the rotational frequency; b) negligible vibration after unit replacement and adding stiffness to support frame.
Conclusions #
Baseline vibration condition monitoring was carried out on a waste recovery plant. The baseline monitoring lasted for approximately 10 working days with one engineer carrying out the measurements. In line with the scheme, plant operators will take over and carry out periodic measurement of all plant, preferably on a one-month or three- month basis. The baseline measurements already showed problems in some key areas thus potentially saving on unnecessary shutdowns. Seven plant operators were trained to carry out monitoring, manage the database and interpret the results. During a practical training session, they already found a bearing problem on another thermal oil pump. This confirms the importance of periodic monitoring. Upon learning the measurement procedure and data analysis basics, the operators themselves commented that this scheme will bring great savings to the plant.
References #
- SKF Reliability Systems, Vibration Diagnostic Guide, CM5003 (Revised 9-00)
- International Standard ISO 10816-3:2009, Mechanical Vibration – Evaluation of machine vibration by measurements on non-rotating parts – Part 3: Industrial machines with normal power above 15KW and nominal speeds between 120 r/min and 1500 r/min when measured in situ, Publication date 2009-02
- Pruftechnik: Choosing Vibration Monitoring Methods, Florian Buder, Oil/Gas/Mining MRO, December 2013
- Pruftechnik: An Engineer’s Guide to shaft alignment, vibration analysis, dynamic balancing and wear debris analysis, ALI 9.600.G, Edition 12, Issued 09.2017
- Vibtrend Monitoring & Analysis, User Guide: Version 1, Test Products International Inc, 2013


