


Ashraf Labib1*, Azzam Saati2 , Akilu Yunusa-Kaltungo2
1Faculty of Business and Law, School of Organisations, Systems and People, University of Portsmouth, UK
2 Faculty of Science and Engineering, Department of Mechanical, Aerospace and Civil Engineering (MACE), School of Engineering, University of Manchester, UK
*Correspondig Author
Abstract #
The purpose of this paper is to investigate the Suez Canal incident by formulating a hybrid model, inspired by maintenance and reliability techniques, that can enable the process of learning from failures. The hybrid model uses a fault tree analysis (FTA), reliability block diagram (RBD), cut set analysis (CSA), and the bowtie method (BTM). The formulated techniques show the synergy between the techniques and how they can be incorporated in order to provide a better understanding of the incident and extract the lessons learned that can prevent a reoccurrence of such an incident. The need for a such hybrid model is essential nowadays since incidents and disasters are becoming more complex, hence a deep analytic technique is required to cover all reliability factors. It can be argued that there is no perfection in using only one technique to address all the reliability aspects, and it is vital to integrate more than one technique, with its particular advantage, in order to have a clear, focused and comprehensive understanding of the area of concern. In addition, it is essential to derive from that level of analysis lessons that can help to improve the overall system reliability and prevent future undesired events.
1. INTRODUCTION #
Is the sky yellow? This question is frequently asked in the Gulf and African regions before planning any trip out. Due to the mother of nature in this kind of region, the word yellow has only one vital meaning (Dusty). The Gulf and African regions have a wide range of desert land. Sandstorm frequently occurs during the period of the year and subsequently affects most planned trip decisions, and the practical decision is to stay grounded until the sandstorm finishes or passes the affected area. This is because the sandstorm is usually riskier than fog, snow, and high wind; specifically, because the sandstorm blocks the complete visibility and has a high air density that can maneuver any heavy objects because of the soil particles and dust contained in the air. Thus, on sandstorm occasions, the safest decision to be taken is to delay or reschedule any planned trip for safety purposes.
On March 23, 2021, a high wind sandstorm occurred in the north-eastern of Egypt, affecting the busiest seaport in the world, the Suez Canal. On that day, 12 ships have navigated successfully through the canal while a high wind sandstorm affecting the vision clarity and ship navigation control. However, one of the giant ship containers in the world (Ever Given) was lined up in the queue to be the 13th ship to navigate through the canal sailing on its way to Rotterdam, Netherlands. Unfortunately, a few miles after entering the canal, the captainship lost control of the Ever-Given ship, causing a diagonal wedge ship position that blocked the entire waterway of the Suez Canal, as illustrated in figure 1. Risk of grounding and collision is one of the major failure modes in navigation of vessels (Bakdi et al, 2019). Moreover, around 46% of collisions occurred in restricted waters; rivers or fairways (Fan et al, 2022). Hence the analysis in this paper provides a set of integrated tools that can help in analyzing the causes of many similar accidents for both prevention and mitigation of risk.
2. LITERATURE REVIEW #
Based on European Maritime Safety Agency (EMSA), the total number of reported ship accidents from 2014 to 2019 is 3,174. The accident classifications and rates were identified as grounding (12.9%), contact (15.3%) and collisions (26.2%) of total reported accidents. Hence, navigation failure is rated to be related to more than half of the accidents. It is crucial to investigate and identify the causal factor of ship accidents to prevent such events since the severity occurring to the human, environment, and the economic impact is very serious, and it is essential to minimize the risk of the incident to reduce the finical losses and negative impacts (Sakar et al, 2021). With engineering reliability and technology development, the understanding of accidents becomes more crucial for both industrial and academia especially when risk and hazard are of a cascading nature (Suppasri et al, 2021).
Major disasters are characterized as of having low probability of occurrence and high severity of consequences. This makes the associated risk assessment characterized by a high degree of uncertainty. Therefore when modelling sources of uncertainty in risk, one can classify such sources into either aleatory (the intrinsic randomness nature of a phenomenon) or as epistemic (due to lack of knowledge) (Taarup‐Esbensen 2020). As will be shown later on, we develop our classification of the causal factors of the chosen incident based on such categorization.
Fault Tree Analysis (FTA) has drawn attention for both sectors by systematically structuring trees investigating the casual factors and their associated relationships. Another distinguished reliability technique is the reliability block diagram (RBD) which expresses the graphical analysis technique to demonstrate the area of concerns of system connection components with their associated reliability of logical relation. Hence, the RBD signifies the system performance based on the effect of component failures. Each of the components is categorized into two boxes which can be described as operating or failing. The RBD have two main classifications parallel RBDs and series RBDs. (Kim, 2011). Additionally, employing a number of techniques to strengthen the investigation analysis has been proposed by using FTA to identify direct causes and their associated contributing factors to simulate the interaction with each other and use it as input to the reliability block diagram (RBD) analysis to measure the effectiveness and the improvement of the overall system reliability (Labib, 2021).
Moreover, A bowtie framework is a broad analysis technique that tends to demonstrate FTA to an integrated analytical model to analyse the causing of the event from one side, and the event consequence from the second side with a traditional FTA top event in the centre of the bowtie model. The bowtie framework has proven its capability for analyzing both retrospective and prospective incidents. Such an integrated structure of analysis will be able to signify system reliability improvement and prevent further reoccurrence of undesired incidents. (Mokhtari et al, 2011).
Based on the literature review above, it is crucial to incorporate more than one reliability technique to investigate and analyse a recent or previous incident to structure a comprehensive model analysis. Therefore, a hybrid technique will be structured to investigate the recent incident (Suez Canal Incident) that occurred on March 23, 2021
3. PROBLEM CONTEXT #
3.1 Egyption Seapoert Suez Canel Overview
The Egyptian Suez Canal operation started in 1869. The Suez Canal’s dimensions are 120 miles (193 km) long, 205 meters wide and 28 meters in depth. In addition, Suez Canal connected the Mediterranean Sea to the Red Sea with a crucial trading waterway between Asia, Africa and Europe, as illustrated in figure 1. In 2020, the canal usage estimated capacity was averaged around 19,000 ships per year with a total tonnage of 1.7 billion tons, the canal controls up to 13 percent of the world’s maritime trade, with approximate 10 percent of oil trade that passes the channel. (Yizhen, et al, 2021).
In 2014, the Egyptian authority launched a new $ 5 billion project to expand the Suez Canal to create a parallel channel, and the expansion was fully completed in 2015. The canal’s estimated traffic was averaged around 49 ships per day before the expansion project. The Suez Canal was expected to accommodate 97 ships per day following the completion of the expansion project. In addition, the vessel transit time and waiting time have been reduced. For instance, the southbound transit time has been reduced from 18 to 11 hours. On the other hand, the vessel waiting time has also been reduced from 11 to 3 hours (Rusinov et al, 2021).
3.2 The Ever Given Ship And The Suez Canal Incident
The named cargo ship (Ever Given) was built by a Japanese shipbuilder Imabari Shipbuilding in 2018. Currently, the vessel is sailing under the flag of Panama, and the vessel is considered one of the 10th largest ships globally. The ship’s container specifications are 400 meters long, 60 meters wide, speed 22.8 knots and carry 18,000 containers. (Yizhen, et al, 2021). The ship accommodates up to 25 sailing crew, the majority from India.
At the time of writing this work in August 2022, the Egyptian Suez Canal incident is still under investigation by the International Maritime Organization (IMO). In addition, an independent investigation is also ongoing by Suez Canal Authority (SCA) since the incident occurred in late March 2021. Unfortunately, various information is still faded until this moment. Therefore, a secondary source of information collection will be used through a widely proven research method to structure the incident.
On March 23, 2021, at 5:40 UTC, Ever-Given was sailing northbound through Suez Canal, heading on its way to Rotterdam. The weather condition at the sailing time was not ideal due to the severe sandstorm with high-speed wind estimated at around 40 knots. (Forti et al, 2021). According to the Suez Canal Authority (SCA), In this kind of weather condition, (SCA) usually leaves the final decision to the captainship to decide to navigate the ship or wait until the weather condition becomes ideal. Ever given was queued at number 13th at that date, where 12 vessels were ahead to be sailed before Ever Given, and the 12 ships have decided to float and made it through the canal and headed its way to the Mediterranean Sea.
Initially, the Ever given decided to sail through the Suez Canal despite the severe weather condition. The (SCA) usually assign an experienced Egyptian pilot to support any ship entering the canal and provide instruction and advice to the captainship during the sailing through the canal. However, the pilot will not have complete control to steer the ship. Therefore, the ship will always be fully steered and managed by the captainship.
Furthermore, once the ship entered the narrow one side canal, the sandstorm with a high wind speed reached 40 knots (74 Km per hour) caused the vessel to swing back and forth in the canal and the control of steering the ship was hardly unmanaged by the captainship. This is due to the fact that the Ever Green containers acted like a sail that generated a significant force that led to the erratic steering and uncontrolled sideway navigation (Khan and Rahman, 2021). However, a few minutes later, the captainship started to increase the ship’s speed to 13 knots, whereas the canal’s recommended speed is 8 knots. Subsequently, the captainship lost control of the ship due to the high wind sandstorm that caused the ship to navigate and aground diagonally in the canal with its bow to one of the banks and the back of the ship grounded to the second bank.
Consequently, a diagonally 40 Degree ship position in the middle of the canal caused a total closure of the southern waterway of the Suez Canal. Subsequently, the blockage caused a traffic jam for more than 360 ships and held more than $ 9.6 billion maritime global trade for seven days (Forti, et al, 2021).
On March 24, the Egyptian (SCA) announced a deceleration of emergency due to Suez Canal blockage and suspension of navigation through the canal. Moreover, all the ships have been diverted to the old canal channel.
On March 25, an operation centre was framed by (SCA) to perform an immediate risk assessment in order to re-float the Ever given ship and clear the water pathway of the Suez Canal. The (SCA) operational rescue plan was consistent with three main options:
First, dredging and digging at the bow of the ship.
Second, Tugboats pull and push the ship.
Third, Offload the ship containers to lighten the vessel.
According to (SCA), the ship owners hired a Dutch firm called Smit who is considered one of the preeminent rescue ships firms in the world. Nevertheless, the rescue operation was managed by the (SCA), and there was not much involvement of Smit firm in the ship rescue operation.
The (SCA) tended to avoid as much as they can the third option since it is a highly risky and extremely expensive approach, and all the cranes and equipment are not available at the site. In addition, such an approach might take weeks or months in order to complete the offload of the ship containers Therefore, the (SCA) focused on the first and the second options.
On March 25-26, (SCA) worked simultaneously on the first and the second options and continued dredging, digging, tugboats pull and push activities, which resulted in freeing the ship’s back by 4 meters from the bank. Moreover, on March 27-28 significant progress was accomplished by SCA where the gap between the bank and the ship’s back was increased by 102 meters. However, the bow of the ship was still wedged.
On March 29, (SCA) decided to use 15 tugboats to pull and push the ship with the association of the high tidal peaks that occurred due to the supermoon on that day, which contributed to increasing the water level in the canal. Furthermore, at 13:30 UTC, Ever Given has completely freed from both sides and the Suez Canal resumed its normal operation.
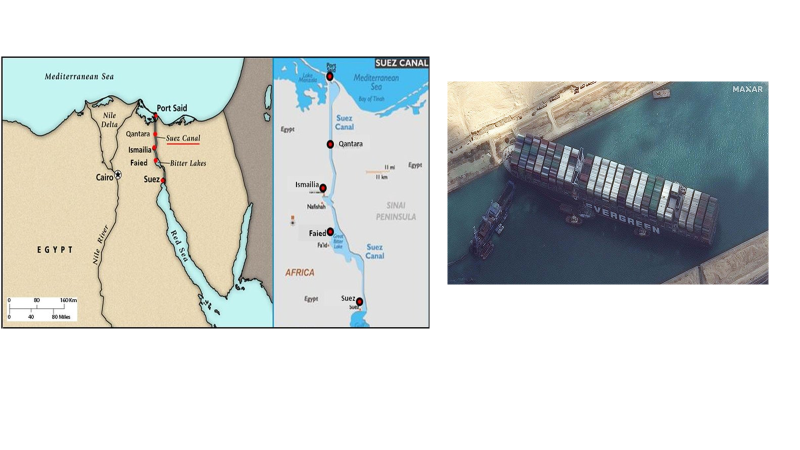
Figure 1. Egyptian Suez Canal on the left, and Ever Given container ship grounded in the Suez Canal on the right [Forti, et al, 2021]
3.3 Consequences Of Suez Canal Incident
Suez Canal blockage: seven days of blockage and ten days of canal maintenance restoration claimed to cost more than $ 100 million.
Vessel Disruption: More than 360 vessels are grounded in or out of the canal due to the blockage, which has held more than $ 15-17 billion for seven days of global maritime trade.
Vessel renavigation: Due to the canal blockage, several vessels have been diverted to use another longer channel through the Cape of Good Hope, which is estimated at around fifteen days delay.
Salvage Reward: Egyptian (SCA) claimed a settlement of $ 1 Billion of a salvage reward. However, the compensation was later reduced to $ 550 million.
Death: In June 2021, the SCA stated that one person died during the six-day salvage operation (Ankel, 2021).
4. HYBRID MODELLING APPROACH #
Incidents and disasters become more complicated each day, and this might be due to the system integration with various advanced designs and technologies. Therefore, a standalone technique might not achieve all the requirements to identify the primary issue of the incident or the disaster since each technique has its capabilities and limitations to reach a particular investigation analysis.
A hybrid modelling approach provides a wide range of terminology to support the investigation team in analyzing and reviewing the event from different angles. For instance, many things can happen in the incident due to a specific factor that can be identified through a particular technique of analysis, which makes this factor the main route cause for the incident to occur. However, in terms of causality analysis, in a hybrid modelling approach, the primary factor might not be necessarily be the main factor that led to the incident, as it can reveal through further analysis of two or three sub-factors to the primary factor, and this can then be identified as the real root cause of the incident.
5. FTA AND RBD FOR SUEZ CANAL INCIDENT #
A comprehensive analysis has been conducted utilizing the FTA technique to analyze, review, and identify the main causal factor for the Suez Canal blockage caused by a wedge grounded Ever-Given ship. In figure 4, FTA of Suez Canal blockage shows two primary causal factors, which are (banks collusion) and (failure associated with perception). Both casual factors have been contributed simultaneously to the canal blockage. Hence an AND gate has been linked to the FTA.
Notice that these two broad factors share similarity with the categorization of causal factors of risk, as proposed by Taarup‐Esbensen (2020) as either based on the intrinsic randomness nature of the phenomenon (aleatory), or due to lack of knowledge (epistemic). In our case banks collusion was mainly due to randomness of weather conditions and lack of effective responsive procedures, and failure associated with perception due to lack of situation awareness or navigation failure.
There are two intermediate events identified that the ship banks collusion was contributed by the insufficient weather condition and procedure failure. Hence an AND gate have been linked to these two factors. Moreover, the insufficient weather condition was caused by poor visibility and high wind sandstorm that was estimated at around 40 knots. Thus, an AND gate have been linked to these two factors.
In addition, failure to follow the canal recommended procedure by violating the speed limit inside the narrow canal, which was 13 knots or lack of communication between the ship and tugboat pilot to follow the right and adequate procedure through navigating the ship inside the canal, which have heavily contributed to losing the ship navigation control. Hence, an OR gate is linked to these two factors. Furthermore, the failure associated with perception was caused by a lack of situational or navigation failure. Hence, an OR gate has been linked to the two factors. Also, the lack of perception was caused either by insufficient captainship reaction time or captainship over-reliance on tug pilots. Thus, an OR gate has been assigned to both events.
Finally, adequate navigation could contribute to preventing the incident from occurring. However, the failure of navigation was caused by either lack of communication between the ship and tugboat pilot or poor coordination to enter the canal in such insufficient weather conditions. Hence, an OR gate is linked for both factors. After carrying out the Suez Canal incident FTA, the Reliability Block Diagram (RBD) is a crucial technique to be used to assess the reliability of the system. The RBD technique uses the basic event generated from the FTA. Each AND gate indicate a parallel structure, and each OR gate indicates a series structure.
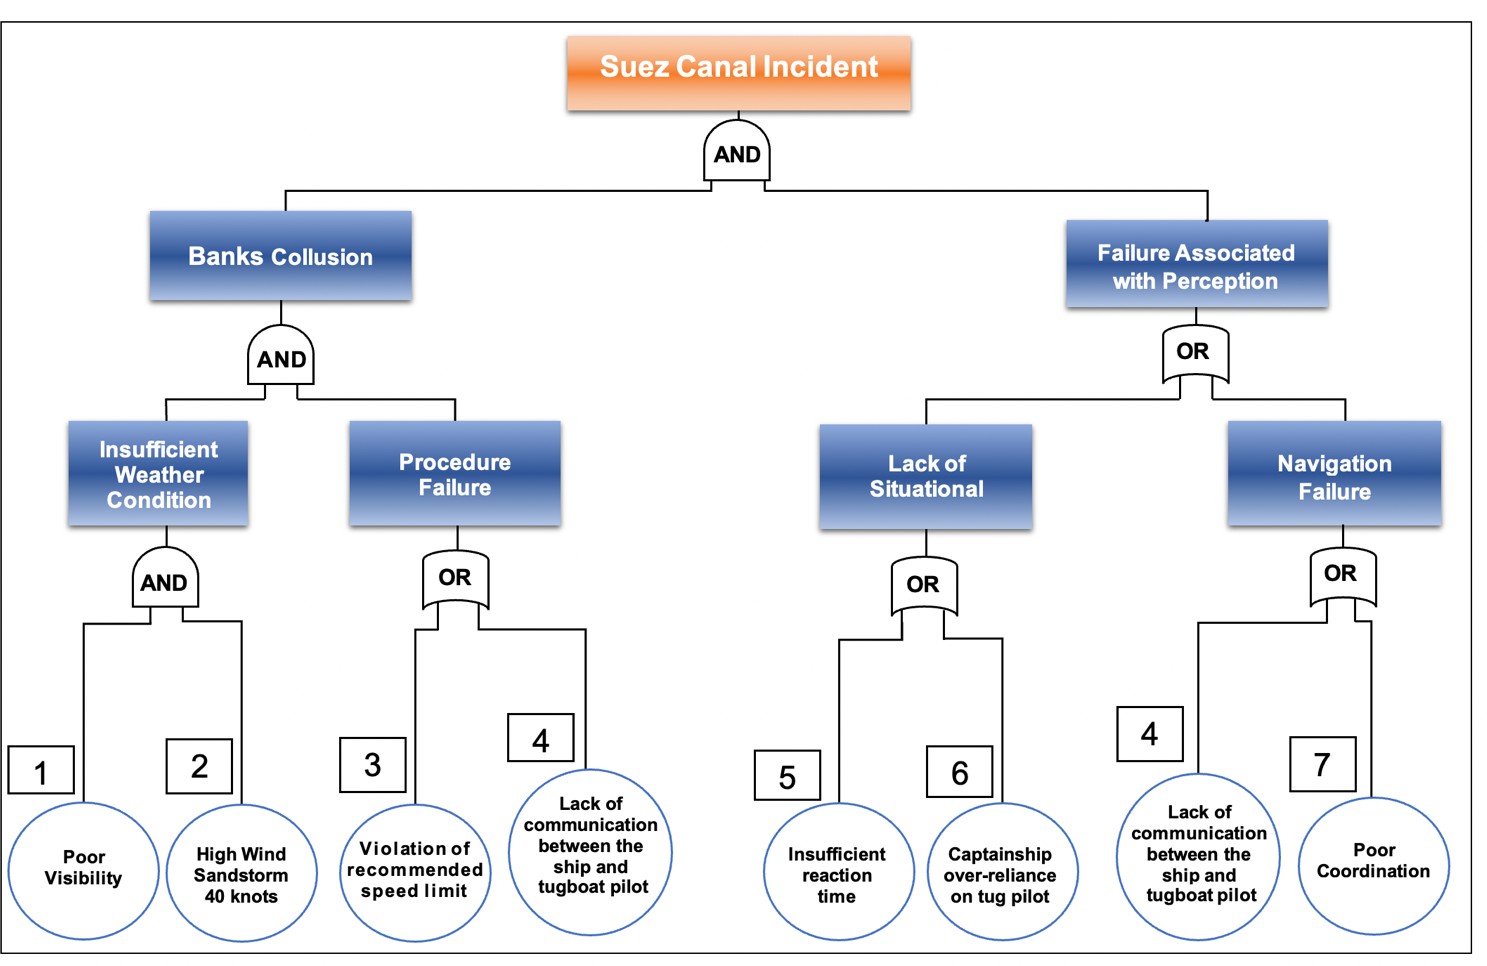
Figure 2. FTA Analysis of Suez Canal Incident
The RBD structured for the FTA Suez Canal incident in figure 3 shows a system vulnerability in the procedure failure items (3 and 4), lack of situational item (5 and 6) and the navigation failure items (4 and 7). In contrast, all the model structures are in a series configuration. Hence, to increase the system reliability, the series structure shall be minimized in order to reduce the failure of the system.
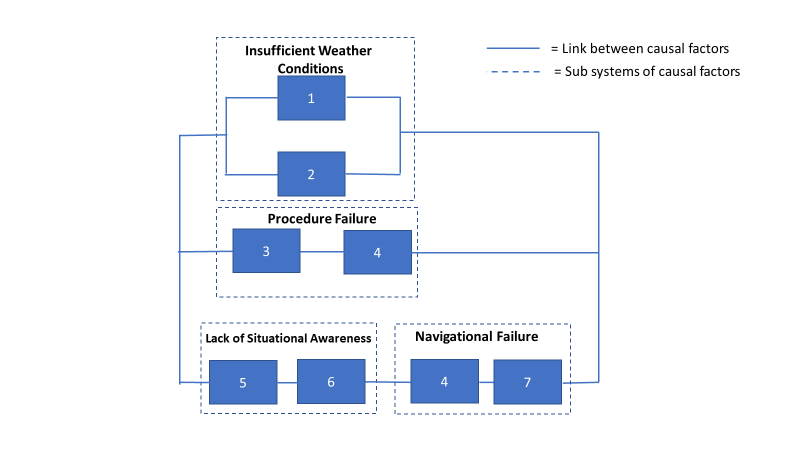
Figure 3. RBD Analysis of Suez Canal Incident
Furthermore, in table 1 and 2, a minimal cut set rules have been driven in this analysis in order to identify any FTA combination events that can be eliminated to avoid a reoccurrence of the Suez Canal blockage.
Note: in Boolean: Plus “+” represents “OR” gate Multiplication “.” represents “AND” gate.
TABLE 1: Axiom of Boolean Algebra
| [A1] a.b = b.a | Commutative Law |
| [A2] a + b = b + a | Commutative Law |
| [A3] (a + b) + c = a + (b + c) = a + b + c | Associative Law |
| [A4] (a.b) . c = a . (b.c) = a.b.c | Associative Law |
| [A5] a . (b+c) = ab + ac | Distributive Law |
TABLE 2: Theorems of Boolean Algebra
| [T1] a + 0 = a | |
| [T2] a + 1 = 1 | |
| [T3] a . 0 = 0 | |
| [T4] a . 1 = 1 | |
| [T5] a . a = a | Idempotent Law |
| [T6] a + a = a | Idempotent Law |
| [T7] a + ab = a | Absorption Law |
| [T8] a (a + b) = a | Absorption Law |
Both Idempotent and Absorptions Laws are described in Appendix.
Therefore, the logic expression has been derived for the Suez Canal Incident (SCI) as the cut set shown below.
SCI = (1.2) . (3+4) . (5+6+4+7)
SCI = (1.2) . (3.5 + 3.6 + 3.4 + 3.7 + 4.5 + 4.6 + 4.4 + 4.7) [Applying [T5]: a.a = a]
SCI = (1.2) . (3.5 + 3.6 + 3.4 + 4 + 3.7 + 4.5 + 4.6 + 4.7) [Applying [T7]: a + a.b = a]
SCI = (1.2) . (3.5 + 3.6 + 3.7 + 4 + 4.5 + 4.6 + 4.7) [Applying [T7]: a + a.b = a]
SCI = (1.2) . (3.5 + 3.6 + 3.7 + 4 +4.6 + 4.7) [Applying [T7]: a + a.b = a]
SCI = (1.2) . (3.5 + 3.6 + 3.7 + 4 + 4.7) [Applying:[T7]: a +a.b = a]
SCI = (1.2) . (3.5 + 3.6 + 3.7 + 4) [Applying [A5]: a (b + c) = ab + bc]
SCI = (1.2.3.5 + 1.2.3.6 + 1.2.3.7 + 1.2.4) [Applying [A5]: a (b + c) = ab + bc]
Therefore, the minimum cut set are as the following four scenarios of combination of causal failures: 1.2.3.5; 1.2.3.6; 1.2.3.7; 1.2.4
Scenario 1: Poor visibility. High wind sandstorm. Violation of recommended speed limit. Insufficient reaction time.
Scenario 2: Poor visibility. High wind sandstorm. Violation of recommended speed limit. Captainship over-reliance on tug pilot.
Scenario 3: Poor visibility. High wind sandstorm. Violation of recommended speed limit. Poor coordination.
Scenario 4: Poor visibility. High wind sandstorm. Lack of communication between the ship and tugboat pilot.
Here each of the above four scenarios contain the least combination of factors that are necessary and sufficient to cause the top event (disaster) to occur. It is interesting to observe that the two factors of poor visibility and high wind sandstorm are common in all four scenarios, and that the violation of recommended speed limit comes as a second highest in terms of priority as it is common in three of the four scenarios.
5.1 Bowtie Model of Suez Canal Incident
The bowtie methodology is an analysis technique named after its shape, and this method identifies the factors that could lead to the high-risk event. (Labib, 2021). In this assessment, the Suez Canal incident will be placed in the centre of the bowtie diagram knot, which also presented the top event of the FTA. The structure model of the bow tie consists of two sides; the first left side of the model is to prevent the threat by constructing safety barriers. On the other hand, the second right side of the model is the proactive approach by controlling and mitigating the consequences of the high-risk events by creating new or additional safety barriers.
The technical logic of the bowtie model is to start with a fault tree analysis on the left side, concentrate on the causes that lead to the top event, and focus on how to prevent it. Then, the right side of the model is constructed around the event tree analysis (ETA) and deep focus on the consequences that occur due to the FTA top event in order to minimize any further escalation as a result of the top event (Labib, 2021)
For example, figure 4 shows the Suez Canal Incident in an integrated model of FTA incorporated in the left side of the bowtie, and figure 5 shows the full bowtie model. The left side of the bowtie model, as illustrated in figure 6, shows the blue boxes where the concentration is on the casual factor’s prevention as a proactive approach, and this could be achieved through the grey safety barriers. In this case, the blue boxes of the Suez Canal indecent that led to the top event are insufficient weather conditions, procedure failure, lack of situational and navigation failure and the prevention safety barriers.
On the opposite right side are the red boxes, which represent the consequences that occur after the top event of the FTA: vessel disruption, canal blockage, reputation damage, and salvage. Hence barriers here are configured to act in a reactive approach to mitigate against the consequence of the hazard.
A question may arise about how the sequence of time is depicted in such modelling techniques? Although the FTA is a logical-based model, where the sequence of time is normally not captured in such analysis, one is able to capture time in terms of causality. Since causality based on the concept of cause and effect implies that a cause happens before an effect, then if A causes B, then A happens before B. Then one can say that if A AND B causes C, then both A and B happen before C. Therefore, the more we go down (vertically) in an FTA the more we go back in time. However, when it comes to Bowtie modelling, the FTA is represented side-ways as shown in figure 4. Hence time flows from left to right, and the same logic can apply on the consequence side of the bowtie model. Such conceptual modeling help to characterize ‘resilience’, which is about the ability to bounce-back after major disturbance. Such linking of bowtie and resilience modeling has been proposed by Labib (2021).
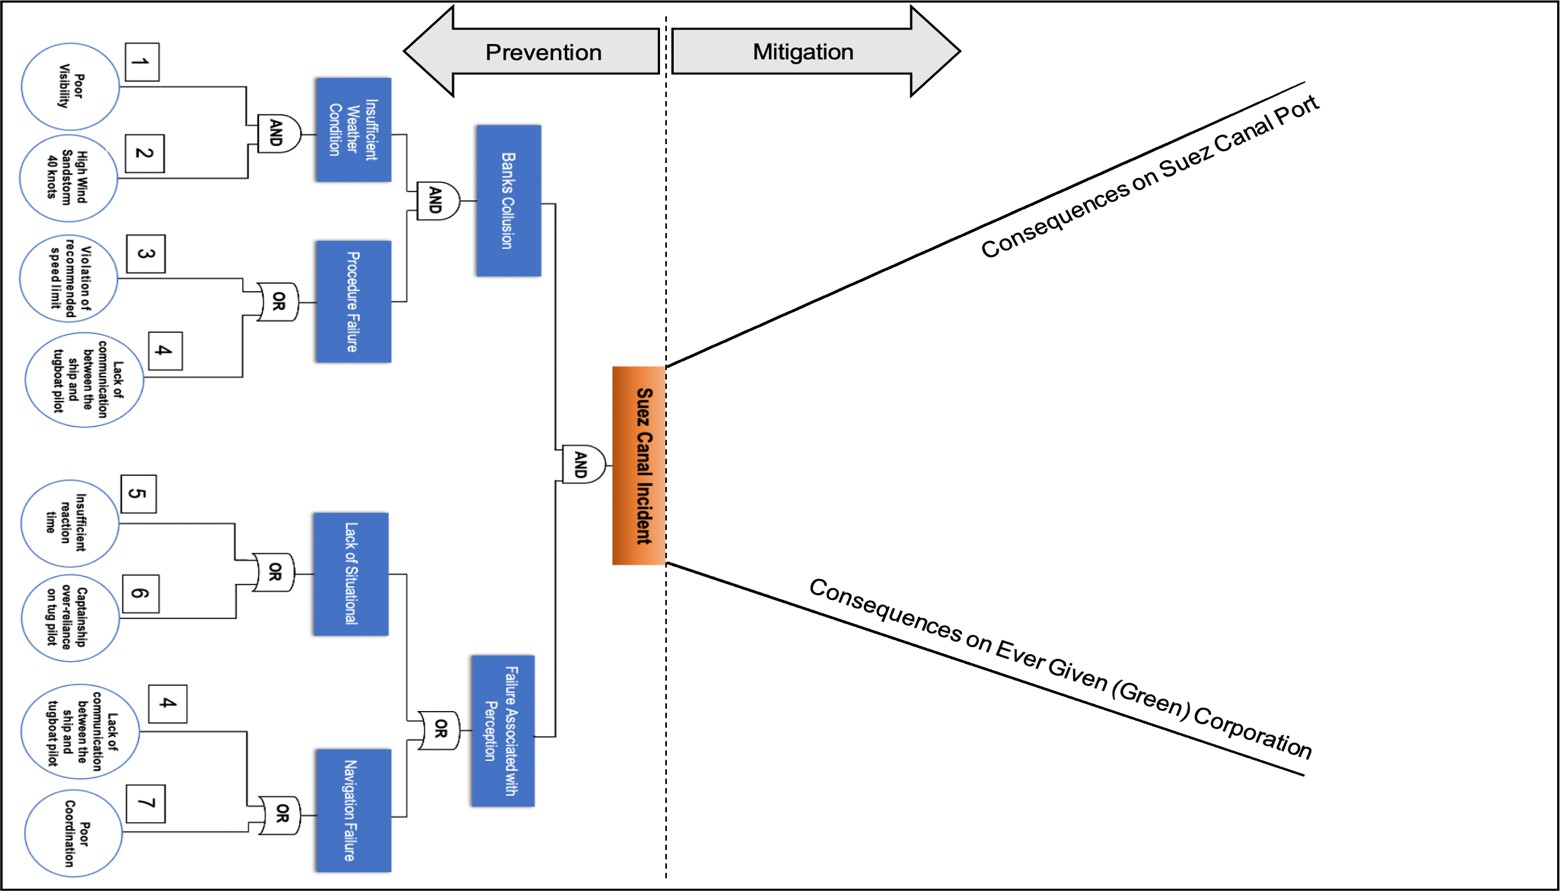
Figure 4. Suez Canal Incident in an Integral model of FTA Incorporated in the bowtie
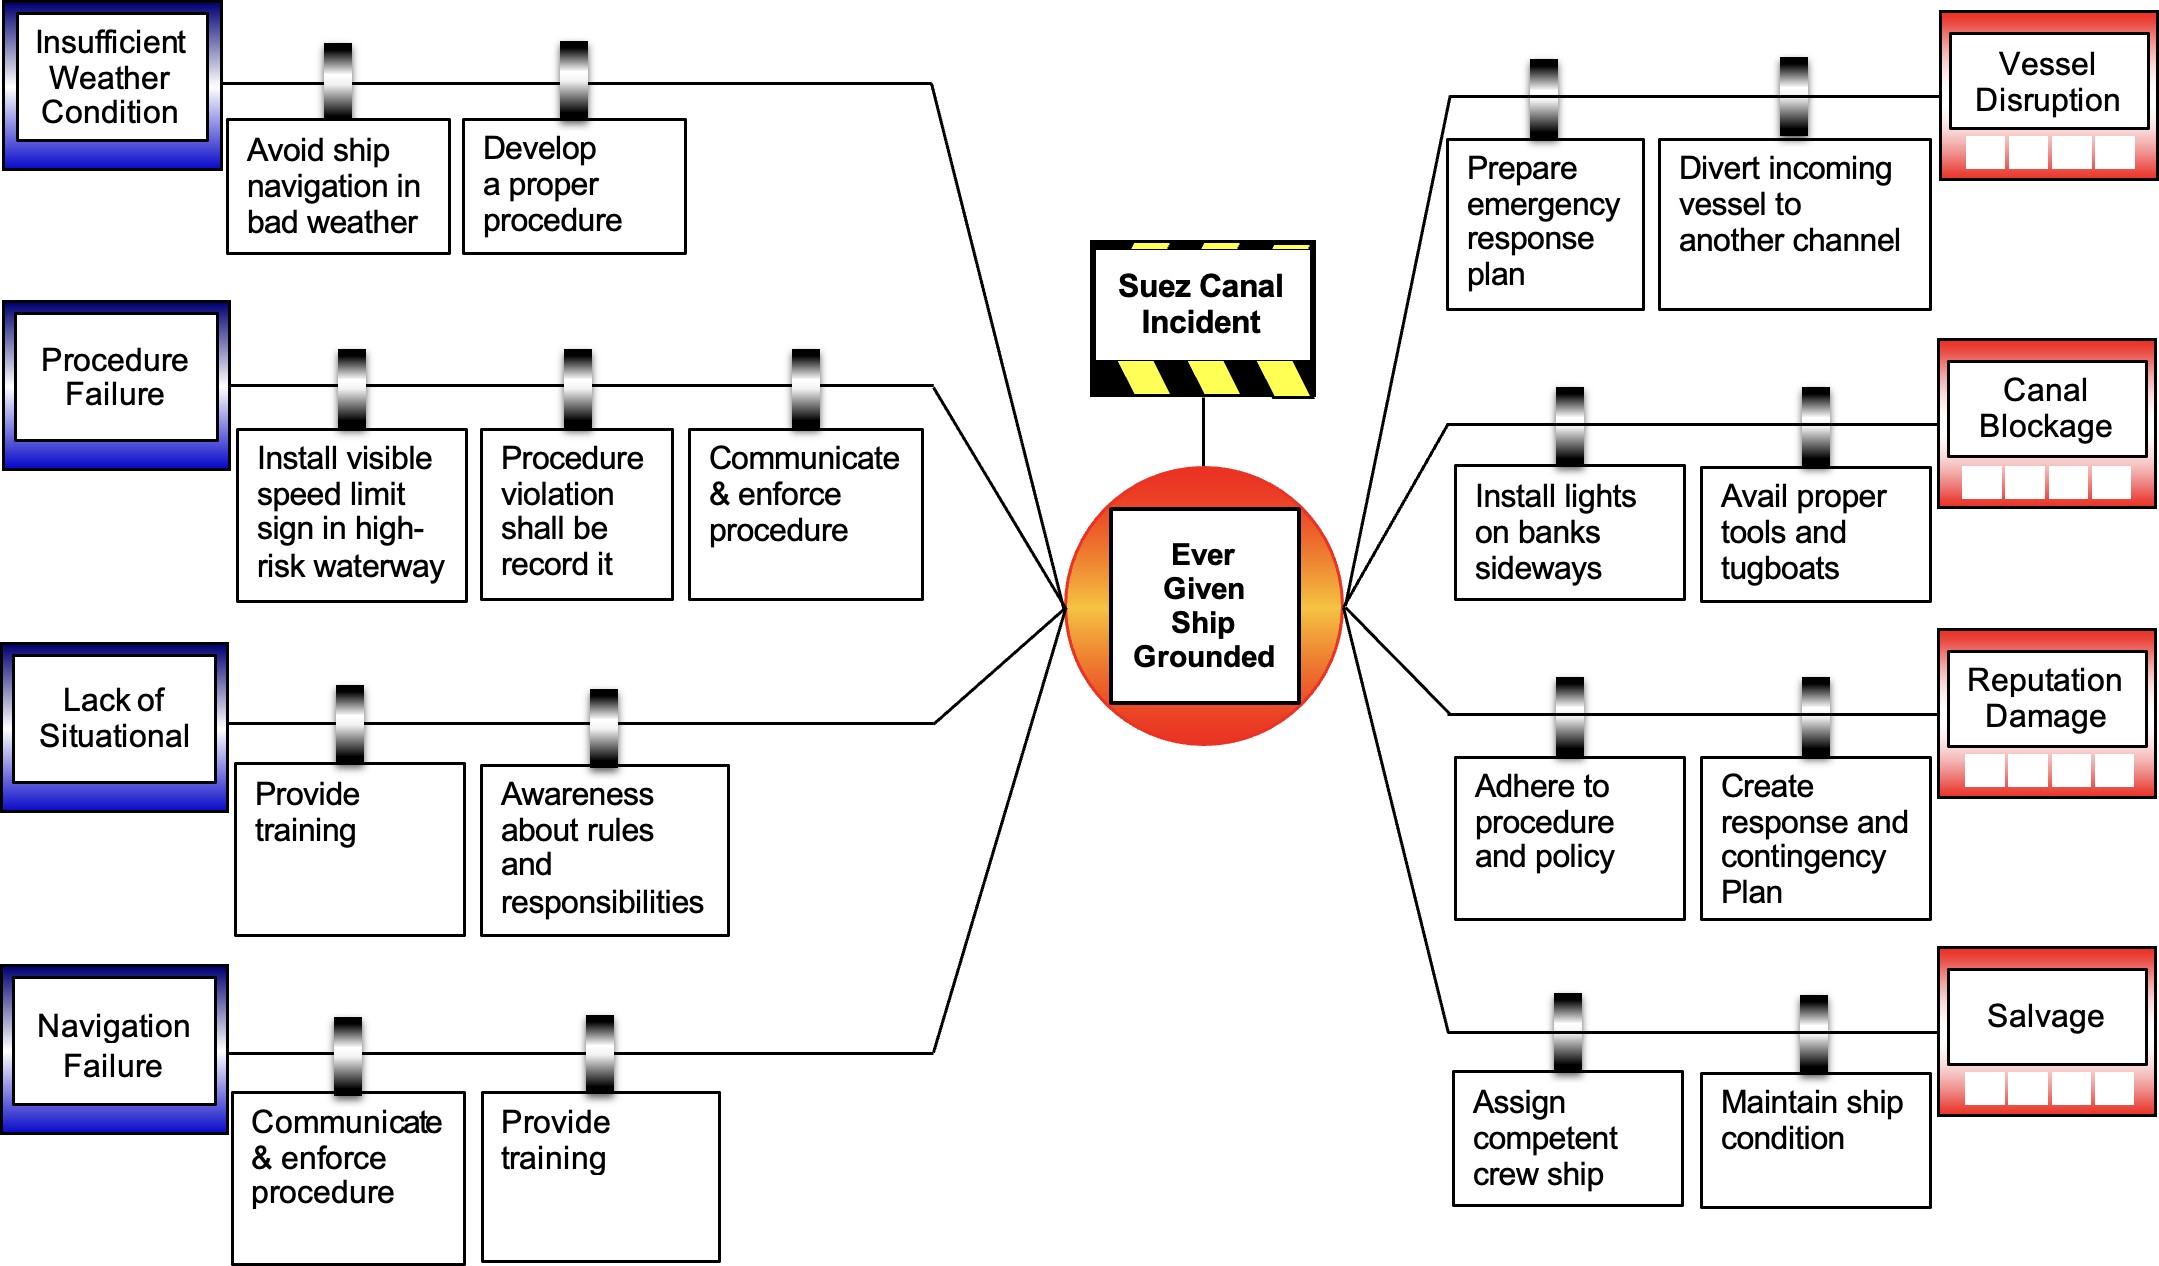
Figure 5. Bowtie model of Ever Given ship grounded of Suez Canal Incident
In order to prevent such an incident from reoccurring, sets of safety barriers have been created for each casual factor, as shown in table 3 and table 4.
Table 3: Classification of Safety Barriers (Preventative/ Proactive)
| Threat | Barrier | Type | Escalation Factor | |
| Insufficient Weather Condition | Avoid ship navigation in bad weatherDevelop a proper procedure | Preventative | Loss of ship navigation control | |
| Procedure Failure | Install visible speed limit sign in a high-risk waterway.Procedure violation shall be recorded.
Communicate & enforce procedure. |
Preventative | A prohibition from using the Suez Canal waterway.Pay fine. | |
| Lack of Situational Awareness. | Provide training.Awareness about rules and responsibilities. | Preventative | Human error | |
| Navigation Failure | Provide training.Communicate & enforce procedure. | Preventative | Human error |
Table 4: Classification of Safety Barriers (Corrective / Mitigation)
| Consequence | Barrier | Type | Escalation Factor |
| Vessel Disruption | Prepare an emergency response plan b.Divert incoming vessel to another channel | ControlMitigate | Traffic jamUses longer channel (Cape of Good Hope) |
| Canal Blockage | a. Install lights on banks sidewaysb. Avail proper tools and tugboats | a. Mitigateb. Control | a. Disturbed global maritime tradeb. Affect global stock markets |
| Reputation Damage | Adhere to procedure and policyCreate response and contingency plan. | Control | Customer uses another carrier |
| Salvage | Assign competent crew ship.Maintain ship condition. | Mitigate | Settlement/awardBankruptcy. |
6. DISCUSSION AND LESSONS LEARNED #
The Suez Canal incident investigation is still ongoing, and there is no official detailed information of what happened exactly on March 23. However, according to the recently published papers and (SAC) official conferences, the initial investigation revealed that the root cause of the Ever-Given Suez Canal incident is the high wind sandstorm that caused the ship to wedge and block the canal, and there is no other information revealed by any entities to provide a framed picture of the incident which was a big challenge to conduct this case study.
Nevertheless, the analysis conducted in this case study agrees and disagrees with the official revealed root cause. For instance, the high wind sandstorm is a contributing factor to the incident. However, it is obvious and easy to detect through the visual or the technologies embedded in the ship or the bridge. Moreover, for some reason, the captainship has finally decided to navigate the ship in such insufficient weather going through a very narrow channel. What is certain, is that the Suez can incident has a major disruption on the global supply chain (Lee and Wong, 2021).
According to BBC News (2021) during a press conference, Osama Rabie, SCA chairman, mentioned that weather conditions were “not the main reasons” for the ship’s grounding, then added that “there may have been technical or human errors”, and that all factors would be looked into in the investigation on the incident. Also according to CNBC (2021) this incident has exposed the need for more research into cascading risk, supply chain disruption and resilience, and impact of pandemics such as COVID-19 on global trade.
Our analysis complements a recent work conducted on the Suez Canal incident using Bayesian Network (BN) analysis, which was indented to extract lessons learned, and have identified them as being due to insufficient information, poor communication, a complacent issue, and in adequate safety culture for the Ever Given organization management (Fan etal, 2022).
Furthermore, the analytical techniques used in this case study identified several safety barriers recommendations in table 3 and table 4 to prevent the reoccurrence of such an indecent. In addition, to the below lesson learned that can be summarized as the following:
Clear communication between the captainship and the tugboat pilot was extremely important during the canal navigation.
Captain of the ship shall always adhere to the Suez Canal navigation procedures.
Insufficient weather can cause unpredictable consequences.
Improve Suez Canalside banks design by:
Installing lights to provide better vision during night, fog or sandstorm.
Safety signs
Wind protection to minimize the wind speed.
Furthermore, during the analysis of the minimum cut sets, we identified four scenarios of the least combination of factors that are necessary and sufficient to cause such a major accident. Each of these scenarios can be embedded in the planning of future training simulation exercises and drills for different stakeholders.
7. STRENGTH AND LIMITATION OF PROPOSED TECHNIQUES #
The integrated approach used in this case study, as illustrated in figure 6 has provided a reliable analytical companied tool to formulate the incident framework to analyse the factors that led to the Suez Canal incident. In addition, it provides the provision to either prevent or eliminate the possible causes to prevent the reoccurrence of such an incident. The FTA was a crucial technique used in this case study to identify the specific undesirable incident event and the causal factors through an AND and OR logic gates and feed the relationships among causal factors to the RBD model with input to demonstrate the overall system reliability. Moreover, the RBD model transforms the FTA gates to parallel or series structures to underline the system vulnerability. Additionally, a minimal cut set was applied to the FTA logic gates to perform an evaluation analysis in order to identify any FTA combination events that can be eliminated to avoid a reoccurrence of the incident.
Furthermore, the bowtie technique has been incorporated with FTA to build a new defense strategy of the system reliability by creating a new safety barrier to control, prevent and mitigate the overall system vulnerability.
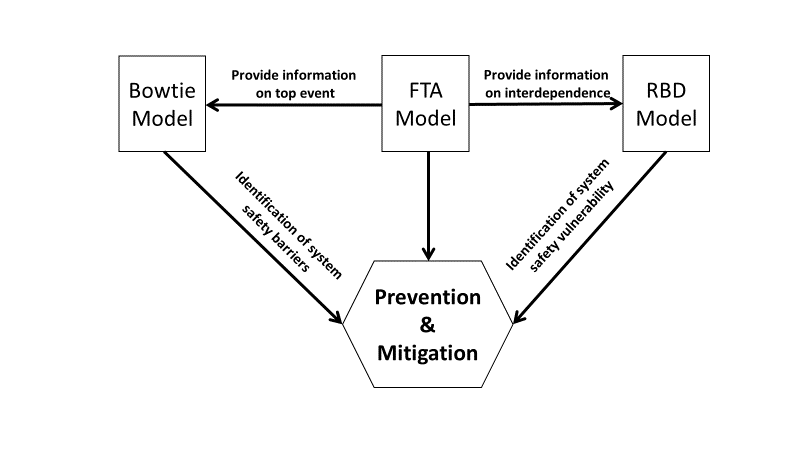
Figure 6. The relationships between the different techniques
Note that in such risk assessment framework there are many uncertainties in practice. This is in line with the literature related to the practical challenges in risk assessment (Taarup‐Esbensen, 2020) that can be itemized as follows:
1.The root cause is not one simple cause but usually a combination of different events that happened simultaneously, or have been affected by each other.
2. Risk assessment relies on assigning a probability of a given event. This assignment requires confidence by having a good statistical sample size. However, a major incident is characterized by high severity and low frequency, which makes such assignment a pure speculative exercise based on evident either from expert assessment or near misses.
3. Risk assessment also relies on estimating the severity of an event, which can be either optimistic or pessimistic consequence based on a worst-scenario estimation.
4. In deciding to enact safety barriers for both prevention and mitigation based on the previous three challenges, it becomes a difficult decision for the organization to have confidence in the efficacy of such barriers.
In the aftermath of any major accident, one is often faced by a messy situation, where there are many uncertainties and complexities involving fragmented information and many stakeholders and with different types of biases. There are three lenses which influence accident analysis, as proposed by Filho et al (2019); Lens 1 is about ‘data’ in terms of its sources and collection methods, Lens 2 is about ‘method’ in terms of type of method for analysis, and Lens 3 is about ‘analyst’ in terms of background profile and biases.
Despite these challenges, it is believed that the proposed model analysis offers a comprehensive approach to carry out a systematic analysis. However, it was limited due to the lack of incident information since there are several factors that are not yet revealed by SCA or the IMO, which was a challengeable factor during the analysis of the case study. Nevertheless, more data would provide a better realistic analysis approach than subjectivity.
8. CONCLUSION AND FUTURE WORK: #
This case study showed the influence of using a hybrid technique approach to address the prevention of the Suez Canal incident by selecting a reliability analysis technique in an integration model. Each reliability technique has a limitation analysis which will cause a gap in the fundamental function of reliability. The advantage of using the hybrid technique in this case study is that it tends to work in a way to determine the reliability analysis limitation by integrating three main techniques FTA, RBD and bowtie, to achieve the desired reliability outcome. For instance, FTA and RBD are structured to provide the incident’s direct cause and contributing factors. In addition, FTA was incorporated in the bowtie to minimize and maximize the system reliability by building safety barriers. Although this case study has demonstrated the capability of the reliability analysis that enriched by the hybrid model approach. However, a Fuzzy bowtie analysis can be considered as future work to clear the uncertain information by calculating the factors’ probability and determining the risk priority. In addition, the Formal Safety Assessment (FSA) method can be deployed to analyse risk and cost benefits to assist the decision-making.
Learning from failures in order to prevent and mitigate against future incidents relates to two key concepts in risk and safety management; resilience and high reliability organizations (HRO). Resilience is about the ability to bounce back and its link to bowtie modeling has been discussed in Section 5 and previously in the work of (Labib, 2021). The concept of HRO originated by (La Porte, 1996; Weick and Suttcliffe, 2001) where it relies on the concept of mindfulness and five features to characterize organizational culture and structure. The measuring of degree of maturity of HRO has then been proposed through a maturity grid in the work of (Agwu etal, 2019). Future work can extend this analysis and integrate it to HRO maturity assessment in order to assess whether lessons have been learnt and provide future directions for improvement
REFERENCES #
Agwu, A. E., Labib, A., & Hadleigh-Dunn, S. (2019). Disaster prevention through a harmonized framework for high reliability organisations. Safety science, 111, 298-312.
Ankel, S, (2021) One person reportedly died while helping free the Ever Given ship, the Suez Canal Authority says, June 12, 2021 (accessed 28 August, 2022) https://www.businessinsider.com/suez-canal-authority-person-died-during-ever-given-rescue-mission-2021-6?r=US&IR=T
Bakdi, A., Glad, I. K., Vanem, E., & Engelhardtsen, Ø. (2019). AIS-based multiple vessel collision and grounding risk identification based on adaptive safety domain. Journal of Marine Science and Engineering, 8(1), 5.
BBC News (2021) Suez Canal: Fresh effort to refloat wedged container ship, 27th March, 2021 (accessed28 August, 2022) https://www.bbc.co.uk/news/world-middle-east-56550350
CNBC (2021) Markets: The ship that blocked the Suez Canal may be free, but experts warn the supply chain impact could last months, 29th March, 2021 (accessed 28 August, 2022) https://www.cnbc.com/2021/03/29/suez-canal-is-moving-but-the-supply-chain-impact-could-last-months.html
Fan, S., Yang, Z., Wang, J., & Marsland, J. (2022). Shipping accident analysis in restricted waters: Lesson from the Suez Canal blockage in 2021. Ocean Engineering, 266, 113119.
Filho, A. P. G., Jun, G. T., & Waterson, P. (2019). Four studies, two methods, one accident–An examination of the reliability and validity of Accimap and STAMP for accident analysis. Safety science, 113, 310-317.
Forti, N., d’Afflisio, E., Braca, P., Millefiori, L. M., Willett, P., & Carniel, S. (2021). Maritime anomaly detection in a real-world scenario: Ever Given grounding in the Suez Canal. IEEE Transactions on Intelligent Transportation Systems, 23(8), 13904-13910.
Khan, I. A., & Rahman, S. (2021). Review and analysis of blockage of Suez Canal region due to giant container ship. Marine Technology Society Journal, 55(5), 39-43.
Kim, M. C. (2011). Reliability block diagram with general gates and its application to system reliability analysis. Annals of Nuclear Energy, 38(11), 2456-2461.
Labib, A. (2021). Towards a new approach for managing pandemics: Hybrid resilience and bowtie modelling. Safety Science, 139, 105274.
La Porte, T. R. (1996). High reliability organizations: Unlikely, demanding and at risk. Journal of contingencies and crisis management, 4(2), 60-71.
Lee, J. M. Y., & Wong, E. Y. C. (2021). Suez Canal blockage: an analysis of legal impact, risks and liabilities to the global supply chain. In MATEC web of conferences (Vol. 339, p. 01019). EDP Sciences.
Mokhtari, K., Ren, J., Roberts, C., & Wang, J. (2011). Application of a generic bow-tie based risk analysis framework on risk management of sea ports and offshore terminals. Journal of hazardous materials, 192(2), 465-475.
Rusinov, I., Gavrilova, I., & Sergeev, M. (2021). Features of Sea Freight through the Suez Canal. Transportation Research Procedia, 54, 719-725.
Sakar, C., Toz, A. C., Buber, M., & Koseoglu, B. (2021). Risk analysis of grounding accidents by mapping a fault tree into a Bayesian network. Applied Ocean Research, 113, 102764.
Suppasri, A., Maly, E., Kitamura, M., Pescaroli, G., Alexander, D., & Imamura, F. (2021). Cascading disasters triggered by tsunami hazards: A perspective for critical infrastructure resilience and disaster risk reduction. International Journal of Disaster Risk Reduction, 66, 102597.
Taarup‐Esbensen, J. (2020). A resilience‐based approach to risk assessments—Building resilient organizations under arctic conditions. Risk Analysis, 40(11), 2399-2412.
Weick, K. E., & Sutcliffe, K. M. (2001). Managing the unexpected (Vol. 9). San Francisco: Jossey-Bass.
Yizhen, Z., Zhengxiong, J., & Deling, W. (2021). Legal Analysis in Maritime Laws Based on Grounding Case of M/V “EVER GIVEN” in Suez Canal. International Journal of Law and Society, 4(2), 107.
Appendix
Idempotent and Absorption Laws:
Both laws are mathematical operations that are either ‘addition-like’ or ‘multiplication-like’, but they are not actually these operations; they are just representations of mathematical operators.
Cut set are sets of basic events that can cause the top event to occur. They can be considered as ‘scenarios’ of a combination of events that can cause the failure (top event) to occur. The idea of minimum cut sets is to reduce these cut sets by removing any redundancies so that one can focus on the core ones that can cause the top event failure to occur.
Idempotent Law:
Idempotence is a feature of a mathematical operation that implies its application of multiple times without altering the final result.
The formal definition is x.x⇔ x
So in other words this means that when two basic events are similar (x) and they both need to occur (AND gate), then the if x fails the whole system will fail (top event)
Figure A1 describes how fault tree can represent the idempotent law for a minimum cut set.
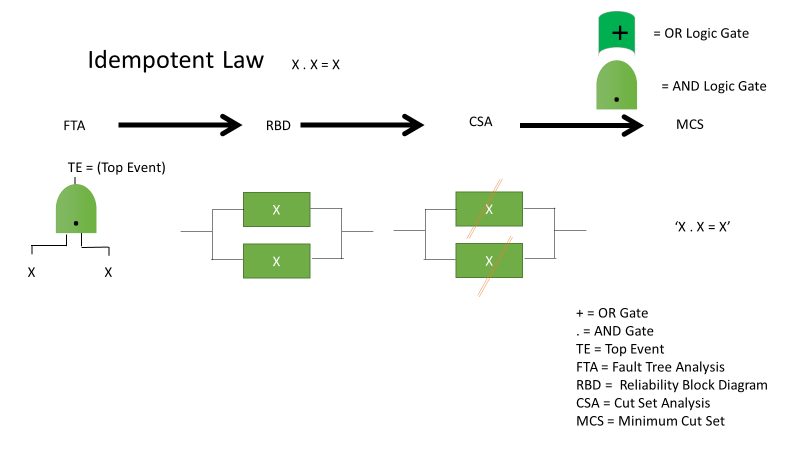
Figure A1: Idempotent Law in FTA and its equivalent RBD
Absorption Law:
Absorption law allows one cut set that contains all the events in another to be eliminated. The formal definition is:
x + x.y⇔ x
x (x + y)⇔ x
In other words, the expression ‘absorption’ implies being absorbed by the term in the consequent.
Figure A2 describes how fault tree can represent the absorption law for a minimum cut set.
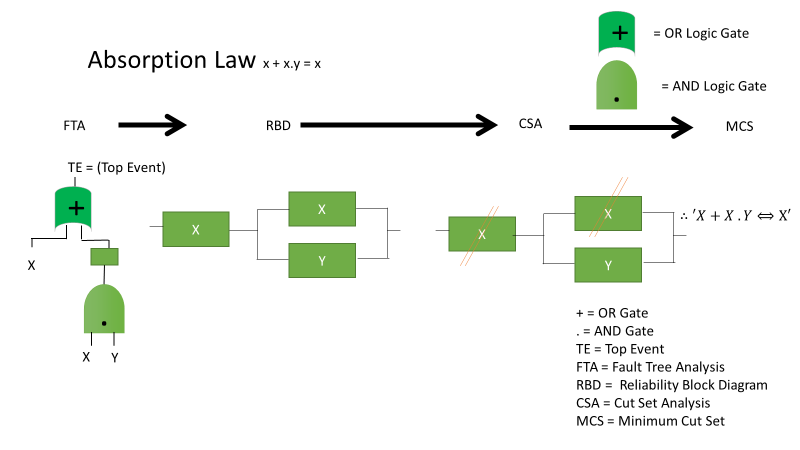
Figure A2: Absorption Law in FTA and its equivalent RBD


