

Dr. Abdelfattah M.Gharieb
Environmental instructor and consultant Dr.abdelfattah.mahmoud@gmail.com Egypt
1 Abstract #
The concerte wastes and its production process are one of the most environmental problem notonly in Egypt but also in the our planet, so the allorganizations in whole world plan an significant role to get rid off this problem that’s by some exertions has been made toward solving this problem like some regulationsor standards or some environmental projects for this purpose.
The main objective of this paper to investigate the physical and chemical properties of coarse aggregates is made using crushing and grading of construction wastes from different sites and landfill locations around Giza and Cairo.
The results showed that the construction wastes could be transformed into useful recycled coarse aggregate and its properties suitable for most green concrete disgen mixes applications in Egypt. From the results obtained, The construction wastes showed the chemical and physical properties are complie with the egyptian code for aggregates in most properties and not complie in Impact value and absorption.
The construction wastes can be used as raw material for road blocks and bariers to over came the waste issues not only in egypt but also all world countries
Abstract
wastes, sustainable, blocks
2 Introduction #
Sustainability can define as meeting the needs of the present without compromising the ability of the future generations to meet their own needs; this definition was created by the World Commission on Environment and Development of the United Nations (World Commission on Environment and Development report,1987).
Sustainable constructions are those constructions which are concern with the minimizing of environmental impact, while optimizing it economically capability. The size of construction industry all over the world is growing at a faster rate, the huge construction growth boosts demand construction materials. Due to continue mining the availability of aggregates; the main constituent of concrete, has emerged problems in recent times, therefore, there is need to find a replacement to some extent.
The most commonly and widely used building material in the world is concrete; with the used of large amount of concrete; pollution is becoming more and more serious. The classical materials produced from the natural resources which use in construction such as concrete, bricks, hollow blocks, solid blocks, pavement blocks, and tiles. This will pose a bad effect on the environment due to continuous exploration and diminishing of natural resources quantities. Moreover, various toxic substances such as high concentration of carbon monoxide, sulfur oxides, nitrogen oxides, and suspended particulate matters are invariably emitted to the atmosphere during the manufacturing process of construction materials. The emission of toxic matters contaminates air, water, soil and aquatic life, and thus influences human health as well as their living standard atmosphere (Król and Błaszczyński, 2013). CO2 is known to be greenhouse gas that contributes to the global warming. Portland cement production, which create one of the biggest problems to the cement industry sustainability is the decrease the limestone quantities, this will effect in economics of cement and concrete industries, the new technologies should be created to produce a concrete with minimum limestone contain, however, it raises the amount of CO2 on atmosphere and other solid wastes. That is being serious environment and atmospheric pollutant. This is happening because of fact that producing cement clinker involves very well-known reaction called calcination of calcium carbonate. Unfortunately there is no technology to reduce carbon dioxide emission of clean Portland cement. The exception of this is multicomponent cements which are produced with an addiction of by- products of fossil fuel combustion or metallurgy industry.
The recycling of solid wastes in civil engineering applications has undergone significant development over a very long time. The exploitation of marble dust, fly ash, blast furnace slag, silica fume, recycled aggregates, calcium carbide residue, foundry sand, etc., in construction materials show some examples of the success of that research. The absence of sustainable practices in construction sector in Egypt led to the lack in environmental data. From strategic perspective,
Three main categories of waste have been identified which are based on the source of the waste and the level of care that needs to be taken in disposal; such as waste from manufacturing activities, packaging items and discarded electronic devices, as well as garden waste and sewage sludge (Ngoc et al., 2009).
Tsai et al. (2004) defined the hazardous waste as a waste or a combination of waste of a solid, semisolid, liquid, and contained gaseous or sludge form, which can pose a substantial present or potential hazard to human health or the environment. Hazardous wastes are mostly generated by industries and commercial operations and from community activities, or as the by-product of manufacturing processes which can release gasses and particles into the atmosphere (Delgado et al., 2007). In some case environmental depletion may result from a discharge to a waterway which would result in a lethal habitat and death of aquatic species such as fish and invertebrates.
Industrial waste may have a high risk of toxicity and be classified as hazardous waste due to containing materials that are actually or potentially hazardous to humans and other living organisms (Hu et al., 2009). Whereas, ‘urban’ wastes mainly include municipal solid waste (MSW), commercial and industrial (C&I) waste, and construction and demolition (C&D) waste. The compositions of MSW include textiles, metals, glass, plastics, paper and organic materials. C&D waste often represents the largest proportion of total waste generated, which accounts for 34% of the urban waste generated within countries, and mainly include concrete, masonry, wood and asphalt (Moh and Manaf, 2017).
Solid waste is trash or garbage, refuse, and other discarded solid materials, which is commonly made up of household waste such as plastics, plastic bottles, tins, cans, paper, and glass (AlSalem et al., 2009). The solid wastes might cause or contribute to increases in mortality, serious illness and environmental depletion, especially toxic chemical and heavy metal pollutions discharged from factories (Duan et al., 2008).
Tsai et al. (2004) indicated that the positive benefits of an increase of recycling programs that can not only reduce facilities required for disposal but conserve energy, cut pollution, and preserve natural resources. Furthermore, Hasome et al. (2001) explained that recycling unused products would save environmental and natural resources as well as minimizing greenhouse gas emissions.
Wilson (2002) reported that recycling of resources currently in the waste stream is an option that many municipalities have implemented in recent years. For example, in England, 37.6% of total waste going to landfill has been diverted from landfill through recycling programs.
3 Research Significance #
The aims of this study was to describe the characteristics and performance of reusable construction solid wastes to minimize its environmental negative effect, and discuss how the green concrete would be able to achieve sustainable construction.
The present study includes a study of the production new mix designs of concrete which have been conducted may be used in construction of road field to make concrete production more sustainable, mainly focusing on reducing the consumption of natural resources.
This study focuses on estalish the using of construction waste on the properties concrete mixes and the ability of using this mixes on sustainable roads precast concrete blocks production.
4 EXPERIMENTAL #
The present study was designed to investigate the replacement of the aggregates, sand and cement on the mechanical properties of the hardened concrete, and then focused on characteristics and analysis of concrete materials manufacturing.
4.1 Materials: #
4.1.1 construction wastes
The construction wastes used in this study was brought from many local areas in Giza and Cairo.
And it were prepared in this study by manual crusher the it whashed by clean water then sevied it with a grain size of 1- 4 mm as showed in (figure 1 to 3).

Figure (1):construction wastes prepartion processes

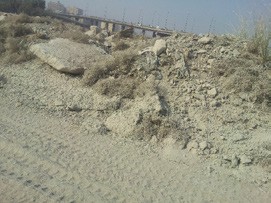
Figure (2):construction wastes collection locations


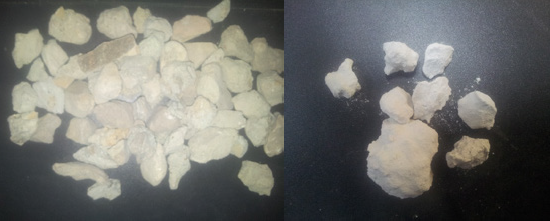
Figure (3):construction wastes after the preparion processes
The construction waste used in this study collected from many local areas in Egypt, the physical and chemical properties as Table (1) as following:
| Test Materials | Bulk density t/m3 | Absorption % | fineness content % | Abrasion index % | Impact value % | Chloride content % | Sulphates content % |
| Demolition waste | 1.2 | 5.5 | 0.8 | 36 | 31 | 0.017 | 0.02 |
| Egyptian code limit | — | ≤ 2.5% | ≤ 3% | ≤ 30% | ≤ 45% | ≤0.04% | ≤ 0.6% |
Table (1): Physical and Chemical Properties of Foundry Sand and Demolition Waste
| Test | Chloride content % | Sulphates content % |
| Results | 0.010 | 0.1 |
| Egyptian code limit | ≤0.04% | ≤ 0.6% |
Table (2) chemical properties of construction waste
The results of chemical analyses presented in Table 3 indicate suitable chloride and sulphate content of clay bricks waste. Chloride and sulphate content ranged from 0.011% to 0.04% of water-soluble clay bricks waste. Thses results showed that the chloride and sluphate conctent were less than the egyptian code limets .
bricks waste. Thses results showed that the chloride and sluphate conctent were less than the egyptian code limets
| Test | Bulk density kg/m3 | Water Absorption% | fineness content % | Abrasion index % | Impact value % |
| Results | 1.2 | 5.5 | 0.8 | 26 | 31 |
| Egyptian codelimits | — | ≤ 2.5% | ≤ 3% | ≤ 30% | ≤ 45 % |
As can be seen in Table 3, construction wastes had bulk denisty 1.2 t/m3 so The bulk density of construction waste is lower than that of natural aggregates. The lower value of loose bulk density of construction waste may be attributed to its higher porosity than that of natural aggregates. However, the construction wastes had nearly twice the absorption of egyptian code limte and were more porous. So abrasion results shows that construction wastes used in this investigation were lower than the limets of egyptian code. And the impact value is lower than egyptian code limets In this respect, construction wastes had a more uniform hardness compared to than for natural aggregates
4.1.2 Ordinary Portland cement (OPC)
The cement that had been used is ordinary Portland cement with nominal particle size of < 90 μm. The chemical composition and physical properties of Portland cement represent in Table (1,2)
| PropertiesMaterial | Initial Setting Time | Final Setting Time | Specific gravity |
| Portland Cement | 72 min | 178 min | 3.16 g/cm3 |
Table (4) Physical Properties of Portland cement
| PropertiesMaterial | Oxides (Weight %) | |||||||||
| SiO2 | Al2O3 | Fe2O3 | CaO | MgO | SO3 | L.O.I | Na2O | K2O | Cl– | |
| OPC | 20.78 | 5.19 | 3.65 | 63.41 | 1.18 | 2.48 | 2.63 | 0.32 | 0.34 | 0.03 |
Table (5) Chemical Composition of Raw Materials of OPC
4.1.3 Natural Sand
The crushed sand is mainly used as fine aggregates in concrete mixes and it came from Upper Egypt.
4.1.4 Water
Tap water used for both mixing and curing in mixes preparation
4.2 Testing Assisting Processes #
4.2.1 Preparation of the Mixes
In this study is shown in Table (6) which measured the effect of replacement of the aggregates and sand by alternative materials as following mixes:
- M1: in which the natural sand, natural aggregates and cement were used
- M2: in which the natural aggregates was replaced by demolition waste and the other components as M1
| Mix | OPC(g) | NS(g) | NA(g) | DW(g) | Water (g) |
| M1 | 3500 | 7500 | 11500 | — | 1800 |
| M2 | 3500 | 7500 | — | 11500 | 2100 |
Table (6): Mix proportions.
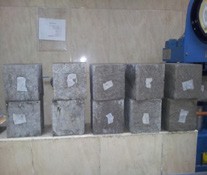
Different mix designs were prepared in this study. These mixes are divided into three groups; the standard cubes of size (150x150x150) mm have been used in this study. For the compressive strength test, three cubes were tested at each age of hydration (7, 28 and 90 days) and the average value was recorded.
Fig. (4): Tested cubes
The mixing was performed using dry mixing for all materials followed by addition of mixing water after the dry mixing.
4.2.2 Testing
A. Curing
For different concrete mixes, immediately after molding, the cubes were cured in humidity cabinet (100%R.H.) at 37±2°C for 24h under water until the required time of testing; 7, 28, 90 days.
B. Stopping of the hydration
The stopping process created for the required time by collected the crashed cubes and put in oven (Technomedica) at 105°C for 3 hours
5 The results #
5.1 Slump test #
The slump test was done during the first minute or immediately and after 30 minutes (STO and ST30) of the above mixes were given in Table (7)
| Mixture I.D. | Slump test (cm) | |
| STO | ST30 | |
| M1 | 16 | 12.1 |
| M2 | 16 | 11.5 |
Table (7): slump test
The results declared that some samples have decreasing rate on the slump value than the other mixture.
These results may be attributed to the presence of recycled wastes material as replacement materials for sand and coarse aggregates, as show of mixes results during the first minute, the results may be as same in M1 and M2 as 16 cm, that was due to the uses of recycle aggregates has the same quality on the slump results which agreed with (Dimitriou,2018)
water absorption values for M1 and M2 were 2100 kg so the partially replacement may give more good results as reported by (Torres,2017).
The slump values at 30 minutes showed that all slump of all mixes decreased might be this due to the hydration reaction of cement on these trails and the change of the plastic state to be in hardened state.
The mix M1 have less decreasing if compared with other mixes and it show that the slump value 12.1 cm in other word it loss 3.9 cm of its slump value but in M2 it loss 4.5 cm to be 11.5 cm that was due to the fines as reported by (Parthiban,2017)
5.2 Setting Time: #
The initial and final setting times were recorded as Table (8)
| Mixture I.D. | Setting time (hours) | |
| Initial | Final | |
| M1 | 4.1 | 7 |
| M2 | 4.2 | 7.3 |
Table ( 8 ): Setting times
The results showed that the mix M1 initial setting time was approx. 4 hours but final setting time was 7 hours that was due to the reaction of concrete component with water specially the cement which effect on it and other components like sand and coarse aggregates.
But the initial setting time of mix M2 showed that 4.2 hours thus the final setting time in mix M2 was 7.3 hours so to the above results the initial and final setting time was more than the M1 or control mix this may be explained by presence recycled fine and coarse aggregates which increased water – cement ratio led to increase the setting time.
5.3 Water absorption: #
The mixes have been tested and all results were recorded in Table (9)
The principal mechanism responsible for water transport during the absorption process is hydrostatic pressure due to the capillary suction. Therefore, the microstructures of concrete, that is, the porosity and pore distribution or micro cracks play a crucial role in the velocity of water ingress. As mentioned above, the cracking direction and connectivity may also influence the speed of water penetration into the samples. Therefore, to fully represent the role of micro cracking, the main water absorption direction is made to be parallel to the compressive loading direction or perpendicular to the tensile loading direction.
| Mixture I.D. | Water absorption (%) |
| M1 | 0.6 |
| M2 | 0.93 |
Table (9): Water absorption results
The water absorption per unit density (1000 kg/L) for M1 and M2, were 0.6 %, 0.93 % respectively as shown in Figure (4-6). The effect of replace aggregates has been increased its water absorption as compared to that of control mix. However, the water absorption of M2 was slightly higher than M1 as shown in Table (10).
recycle aggregates as fully aggregates replacement material has been effect on its water absorption so the C-S-H gel formation has reduced the pore size which resulted in lower water absorption in M1.
The water absorption gives an idea of the total pore volume, but is not representative for the permeability of the concrete.
5.4 Compressive strength: #
The compressive strength tests were conducted on the hardened concrete cubs after 7, 28 and 90 days of hydration. The compressive strength results of the hardened concrete mixtures were listed in Table (10) and the results of compressive strength were analyzed to study the effect of age on strength development
| Mixture I.D. | Compressive strength (kg/cm2) | ||
| 7 days | 28 days | 90 days | |
| M1 | 185 | 294 | 289 |
| M2 | 170 | 267 | 265 |
Table (10): Compressive strength results at the different ages of hydration
The results were also compared to a control mixture in order to illustrate the decreasing in compressive strength as a result of full aggregates replacement.
In addition, the results of compressive strength were analyzed to study the effect of age on strength development
Table (10) clearly showed that all the concrete mixes made of OPC mixed with different type of aggregates have lower compressive strength than those control mix M1 at all curing ages (7,28 and 90 days).
For example, the concrete mix specimens make of mix M2 recorded a strength of 172 kg/cm2 at 7 days, while the strength of control mix M1 was 188 kg/cm2 at the same age. Therefore, the reason behind this strength not affected by full replacement of natural coarse aggregates by recycled aggregates as reported by (Dimitriou,2018) as the results in this study but (Özalp,2016) disagreed with the results and suggested that the recycled aggregates have direct affect in compressive strength due to the rate of water absorption which affected in strength processes.
However, concrete mixes produced at age 28 days which attained a compressive strength of 268 kg/ cm2 for the M2 at the same age were collectively lower than the conventional control mix that displayed strength of 291 kg/cm2.
The compressive strength results for the mixes were slightly lower at 90 days of hydration than the results at 28 days like in M1 which recorded that 289 kg/cm2 and the other mixes showed as M2 recorded 265 kg/cm2,
5.5 Morphology and microstructure #
Scanning electron microscopic (SEM) examination was carried on the hardened concrete mixes (M1 and M2).
This SEM study was done in order to analyze the microstructure of different hardened concrete mixes and to compare the results with the microstructure of the hardened control concrete mix M1.
Also the results SEM observation were used to confirm the results of other properties of the different hardened concrete mixtures such as ,normally, the results of compressive strength and water absorption.
5.5.1 Control concrete mix M1
The SEM micrographs of the control concrete mix (M1) after 7 days this figure displayed with porous structure that containing pores. Also it can be seen the existence of many Ca(OH)2 crystals connected to the nearly amorphous C-S-H gel which indicate that the hydration process is not completed and also explains the low records of compressive strength for the control concrete mix (M1). Also, the same micrograph shows that the calcium silicate hydrates (C-S-H) gel was engulfing feel with calcium hydroxide (CH).
At the age of 28 days, the SEM micrograph shown in Figure (6) also indicates the existence of (C-S-H) hydrate needles and the more dense structure of the hardened concrete mix of M1 that matches the high strength results.
Figure (5) still showed the Ca(OH)2 crystal needles and cracks for the mixture that is jointed to the C-S-H gel after 90 days of hydration , however, which also confirms the strength results reported in this study.
It is also noticed from the figures that both size and quantity of the needle like calcium silicate hydrates at the age of 7 days have been lessened at the ages of 28 days and 90 days which is due to the completion of the hydration process in order to produce more C-S-H gel. This explains the high results of strength for the hardened concrete mixes at the age of 28 days in comparison to the results at the age of 7 and 90 days.

5.5.2 Concrete mix M2
The SEM micrographs of the mix M2 at 7 days showed that its structure has a moderate amount of pores as illustrated in Figure (38) and that the hydrate products is connected and lapped to a number of hydrate needles.
Also, at the age of 28 days, many cracks and voids were be seen in Figures (8) which match the compressive strength results and the justification that was mentioned before.
Also, the particles to form weak clusters that were used to explain the drop in the compressive strength for this particular particle size is increased can be clearly seen in Figure (8) which justify the low strength results at 28 days age.
Also, Figure (9) showed forming the weak clogs and hydrate needles for this mixture at the age of 90 days.

6. CONCLUSIONS #
Based on the scope, materials, techniques, procedures and other parameters associated with this work, the following conclusions can be stated:
- The hardened concrete trials investigated possess equal compressive strength values on those of control hardened concrete trials exhibited relatively
- The above wastes caused a great amount of environmental pollution so by reusing and recycling of these waste materials as raw materials in the manufacturing of industrial brick and other composite materials have a great contribution to the economy and to the environment by minimizing polluting effects coming from different plants.
- Based on the results of this study, the following conclusions can be drawn; In general, the addition of wastes played significant changes in the relevant functional characteristics like decreasing the compressive strength results so the mechanical properties of bricks were affected remarkably.
7. REFERENCES #
- Abdelhamid Manal S. (2014) Assessment of different construction and demolition waste management approaches. HBRC Journal 10, 317–326
- Aggarwal Yogeshand Rafat Siddique 2014. Microstructure and properties of concrete using bottom ash and waste foundry sand as partial replacement of fine aggregates ,Civil Engineering Department, Thapar University, Patiala 147004, India
- Amit Nayak , P.H. Patil and A.C. Nayak,(2016), Utilization of Limestone Dust and Marble Dust in Concrete, IJSRD – International Journal for Scientific Research & Development| Vol. 4, Issue 06, 2016 | ISSN (online): 2321-0613
- Arel Hasan Şahan 2016. Recyclability of Waste Marble in Concrete Production,Faculty of Architecture, İzmir University, GürselAkselBulvarı, No:14, 35350, Üçkuyular / İzmir / Turkey
- Cakır O. 2014. Experimental analysis of properties of recycled coarse aggregate (RCA) concrete with mineral additives,Yıldız Technical University, Department of Civil Engineering, 34220 Istanbul, Turkey
- Deepankar Kumar Ashish, S K Verma, Ravi Kumar and Nitisha Sharma 2016. Properties of concrete incorporating waste marble powder as partial substitute of cement and sand, Maharaja Agrasen Institute of Technology, MAU, Baddi 174-103, India
- Imbabi Mohammed S., Collette Carrigan, Sean McKenna (2012) . Trends and developments in green cement and concrete technology. International Journal of Sustainable Built Environment (2012) 1, 194–216
- Król M., Błaszczyński T. (2013). Geopolymer Eco-concretes, Construction Materials, 11: 23-26.
- Marchioni Jorge Lyra, Rafael Pileggi, Raquel Luisa Pereira ,Mariana L. and Claudio Oliveira 2012. Foundry Sand for Manufacturing Paving Units, Engineering. Associação Brasileira de Cimento Portland (ABCP) Av. Torres de Oliveira, 76 São Paulo, SP, BRASIL, CEP 05347-902.
- Martín-morales m., m. Zamorano, i. Valverde-palacios, g. M. Cuenca-moyano and z. sánchez- roldán,(2013), Quality control of recycled aggregates (RAs) from construction and demolition waste (CDW), University of Granada, Spain DOI: 10.1533/9780857096906.2.270
- Moirangthem E., Meetei SL. (2017). A Review On Green Concrete International Journal of Engineering Technology Science and Research IJETSR www.ijetsr.com; 4 (3): 2394 – 3386.
- Munir Muhammad Junaid, Syed Minhaj Saleem Kazmi, Yu-Fei Wu ,(2017), Efficiency of waste marble powder in controlling alkali–silica reaction of concrete: A sustainable approach, Construction and Building Materials journal, 154 (2017) 590–599.
- PandaaK.C.and P K Balb 2012. Chemical, Properties of self compacting concrete using recycled coarse aggregate, Civil and Mechanical Engineering Tracks of 3rd Nirma University International Conference on Engineering (NUiCONE 2012)
- Patel Ankit Nileshchandra and JayeshkumarPitroda 2013. Stone Waste :Effective Replacement Of Cement For Establishing Green Concrete, International Journal of Innovative Technology and Exploring Engineering (IJITEE) ISSN: 2278-3075, Volume-2, Issue-5
- Penkaitis Gabriela and Joel BarbujianiSígolo 2012. Waste foundry sand. Environmental implicationandcharacterization, Resíduo de areia de fundição. Caracterização e implicação ambiental,DepartmentofSedimentaryand Environmental Geology, InstituteofGeosciences, Universidade de São Paulo – USP, Rua do Lago 562, CEP: 05508-080, São Paulo
- Safiuddin, M. Jumaat, M.Z. Salam, M. Islam, M. Hashim, R. (2010). Utilization of solid wastes in construction materials, International Journal of Physical Sciences. 5 (13): 1952-1963.
- Siddiquea Rafat, Gurdeep Kaurb and Anita Rajorb,(2010), Waste foundry sand and its leachate characteristics,Department of Civil Engineering, Thapar University, Patiala (Punjab)–147004, India
- Suhendro Bambang (2014). Toward green concrete for better sustainable environment, 2nd International Conference on Sustainable Civil Engineering Structures and Construction Materials 2014 (SCESCM 2014)
- Tomas U. Ganiron Jr (2015). Recycling Concrete Debris from Construction and Demolition Waste. International Journal of Advanced Science and Technology.77:7-24. http://dx.doi.org/10.14257/ijast..77.02.
- Torres Anthony , Laura Bartlett, Cole Pilgrim, (2017), Effect of foundry waste on the mechanical properties of Portland Cement Concrete , Construction and Building Materials journal 135 (2017) ,674–681


