


Abdel-moez Bayoumi1, Amr A. Abdel Fatah2, Rhea Matthews1, Ibrahim Yousif1
1University of South Carolina, Columbia SC, USA bayoumi@sc.edu, rheamatthews@sc.edu, iyousif@email.sc.edu
2The British University in Egypt, El-Shorouk City, Egypt Amr.Abdelkader@bue.edu.eg
Abstract #
Industries across the world are realizing the benefits of Industry 4.0 and digital transformation. The University of South Carolina (UofSC) has been using digital transformation to transform processes in multiple industries and has defined a clear roadmap for implementing digital transformation that has been validated by use cases. UofSC has partnered with The British University in Egypt (BUE) to develop a framework for applying digital transformation to advance the water desalination industry. This collaboration utilizes BUE’s experience in design and manufacturing of physical systems such as a high- pressure pump and UofSC’s experience in applying digital transformation to industries and developing digital twins of systems.
Keywords: Digital Transformation, Water Desalination, Industry 4.0
1 Introduction #
Fresh water shortage is threatening development and prosperity in many Middle Eastern countries, as well as several areas in the United States. Sea water and ground water reverse osmosis desalination is fast becoming a dominant technology for facing water shortage threats by cost effective production of fresh water for multiple purposes. Water desalination applications extend not just for desalinating drinking water, but also impacts various types of industries. With the rapid growth in the pharmaceutical industry, desalinated water is used for drug testing and diluting certain solutions, and in the oil and gas industry, fresh and low salinity water supplies are essential for enhanced oil recovery (EOR) applications. Offshore and onshore petroleum platforms in remote areas require gallons of freshwater every day, while shipping to these platforms is costly and inefficient. Furthermore, low salinity water injection is required to maintain reservoir pressure and stabilize the production rate. Consequently, on-site water desalination technology can benefit the oil and gas industry as it is efficient and less expensive.
This paper will present a methodology for applying digital transformation and the impacts it can have on the water desalination industry. The next two sections of the paper present an introduction to digital transformation, industry 4.0, and the water desalination industry. Following is the methodology developed by UofSC for digital transformation and a water desalination use case focusing on a single component, a high-pressure pump, will highlight the challenges and outcomes of digital transformation. Future work could include the expansion of this use case to additional components, subystems and systems.
2 Digital Transformation and Industry 4.0 #
Digital transformation is more than just a singular tool, it is an entire process that takes advantage of new technologies and techniques such as artificial intelligence and augmented reality while also utilizing and optimizing the human factor in a workflow. It is a shift in the way people think about technical challenges that combines systemic problem-solving, cost- reduction, product creation, and decentralization to approach the problems of the future with new methods, new mindsets, and a finely tuned drive to do better. Implementing digital transformation will lead to a decrease in cost, a decrease in time spent, and an increase in overall quality. An effective digital transformation implementation is not only about using state-of- the-art technologies but also includes the training and education of all users.
The following technologies are key to the successful implementation of an industry 4.0 or digital transformation program.
- Cyber Physical Systems: Integrated computational and physical capabilities
- Internet of Things: Network of physical components that are digitally connected and can sense, monitor, and interact
- Digital Twin: Developed in conjunction with its physical twin and remains its virtual counterpart through the whole product lifespan
- Virtual Reality/Augmented Reality: Can be used to mimic and simulate real-life scenarios that are either expensive or challenging to conduct
- Cloud Computing: Model for enabling on-demand network access to a shared pool of configurable computing resources
- Simulations: Computer-based technologies focused on explicit and specific modeling tasks
In addition, there are 5 key challenges when implementing industry 4.0 and digital transformation technologies. These challenges include:
- Integration: Data is key to an Industry 4.0 or Digital Transformation program. It is necessary to incorporate data from multiple sources to support preliminary connectivity. There is also no one size fits all approach to implementing an Industry 4.0 program.
- Control: Industry 4.0 requires the connection of every sensor, actuator, PLC and other elements. It is important to ensure that there is a secure and reliable method for transferring data in place and to allow for analysis in real time. This also requires reliable internet and wireless connections to facilitate these transfers.
- Communication: How to create an appropriate model for secure communication and interaction between autonomous agents (with different operating systems) that are all connected through an IIOT network?
- Legacy Systems: A main difficulty with the integration of Industry 4.0 into legacy systems is the availability and or accessibility of data to obtain information. Consequently, the communication infrastructure must be altered and improved to a more transparent architecture.
- Cyber Security: In the age of Industry 4.0, where machines and “things” are connected to the network and each other, the scale and variety of cyber-attacks have grown exponentially. Data rights concerns when deciding on third- party vendors for hosting and operating company data.
2 Water Desalination #
Drinking water is considered a gift from nature to many countries. As the world population grows and consequently the demand for freshwater for urban, agricultural, and industrial use increases, so do the challenges arising from the need to meet global market demand with innovative technologies. Fresh water shortage imposes considerable threats and challenges for the development plans in many Arab and Middle Eastern countries. During the coming decade, it is expected that about two thirds of Arab countries are expected to suffer from acute water scarcity [1, 4]. Sea Water Reverse Osmosis (SWRO) desalination is fast becoming an inevitable solution for facing water shortage threats by cost effective production of fresh water.
2.1 Desalination Plant #
The main components of a reverse osmosis desalination plant are illustrated in Figure 1.

Figure 1. Key Components and Systems of a Water Desalination Plant
These components include:
- The energy source that is used to operate the desalination systems can either be conventional or renewable energy.
- The feed pump for the high-pressure pump should be a self-priming pump to protect from cavitation. It should also be in an accessible place below or above the waterline to allow for easier maintenance in the future.
- Pretreatment system is essential to pretreat the feed water from any suspended solids and make sure that microbial growth and salt precipitation is not taking place on the membranes surface. Pretreatment can include chemical feed followed by sand filtration, sedimentation, flocculation, and coagulation as conventional methods.
- High-pressure pump (HPP) is considered the heart and the essential mechanical element of the reverse osmosis water desalination system since the reverse osmosis (RO) is a pressure driven separation process as required feed pressure must go beyond the built osmotic pressure, increasing directly with water salinity. The HPP generates in the range of 600-1200 psi with seawater and around 150 psi for slightly brackish water that generated pressure supplies the water with the needed pressure to pass across the RO membranes and reject salt.
- Reverse osmosis membranes are a pressure driven separation process that is simple, economically competitive, and do not require phase change, which is particularly important for heat solutions sensitivity, such as pharmaceutical materials and food products. RO has become the primary desalination method in the United States and is capable of desalinating high saline feed water. There are two common RO membrane types for water desalination: Spiral wound and hollow fiber. The spiral wound membrane is widely used in desalination more than the hollow fiber membrane. The advantages of reverse osmosis are considerable:
- Capable to waters with any saline content, from groundwater to seawater.
- Relatively low operating costs compared to resin plants, especially in the presence of influential high salinity.
- The simplicity of operation is a process that does not require periodic regeneration as occurs in resin plants.
- Post-treatment at this level, water is getting to stabilize and getting to prepare for distribution. Disinfection and adjusting the alkalinity, hardness, and pH are necessary if combined with other water supply sources to meet up with the drinking water standards and prevent any corrosion effect in the distribution network.
2.2 High Pressure Pump #
Pumps are mechanical devices that converts mechanical energy into hydraulic energy. They are divided into two main types the positive displacement pumps such as piston pumps with industry market share of 27% and rotodynamic pumps such as centrifugal pumps with industry market share of 73%. Typical pressures for SWRO desalination are in the range of 50 – 80 bar. High-pressure pumps (HPP) have a critical role in an SWRO desalination plant. The role of the HPP is to raise the pressure of the feed flow to allow for the permeation process through the RO membranes. Maintaining the HPP and working under healthy conditions keeps the desalination plant running smoothly, this is crital as fresh water is vital to maintain human lives. The use of the centrifugal pumps is 16% among all the rotodynamic pumps and their area of applications are continuously expanding [5]. With the continuous expansion of centrifugal pumps usage new problems will exist, proper pump selections are essential as it can avoid/prevent problems that may occur. improper pump selection leads to several operating problems such as cavitation, flow discontinuity, pump surge, etc.
Either single-stage or multi-stage centrifugal pumps prevail the desalination plants for feeding and pressurizing the feed stream. Common problems experienced by centrifugal pumps such as cavitation, water hammering, sludge, high-pressure pulsation, excessive power consumption, and other mechanical and hydraulic failures may be attributed to one or several probable causes. Low suction pressure and low flow rate problems can be attributed to either air leaks in inlet piping or a faulty mechanical seal [1]. Centrifugal pumps cavitation can also lead to the same problems. Excessive lateral or axial vibration and noise can also be attributed to either pump rotor misalignment, excessive axial thrust or cavitation and reduces the pump efficiency.
2.3 Fault Detection #
Fault detection improves the system reliability, safety, energy, and cost-efficiency, extends the pump lifetime and performance, achieves the efficient maintenance strategy, and reduces occurring unpredicted events that can lead to system shutdown and breakdowns. Early fault detection and diagnosis are essential to ensure cost-effective and safer operation to avoid performance degradation, unpredicted maintenance events, product deterioration, minor and major damage to the physical system, damage to human health, or even loss of lives. This paper focuses on one type of fault which is the cavitation as a use case due to its frequent occurrence. Many papers have been done fault detection in the pumping system based on speed variation and vibration details using signal processing and statistical models or based on machine learning algorithms that identify the cavitation using speed and pressure historical data [6, 7].
Cavitation can be considered as a major cause for centrifugal pump failures. In the first phase of cavitation, vapor bubbles are formed around the pump’s impeller in areas of relatively low pressure below the associated vapor pressure of the working
fluid. While in the second phase of the cavitation, the collapse of these bubbles allows the triggering of intense shockwaves leading to high-speed fluid particles impact causing significant pitting and erosion of the internal pump parts [9]. Cavitation is a main source of centrifugal pumps health and performance degradation. Several researchers employed CFD analysis [1] to detect cavitation and evaluate its effect on the rotor and the pump’s casing, which allowed the minimization of the experimental investigations.
Cavitation analysis is performed at different operating conditions including different pump speeds and flowrates. The detection of bubbles formation by CFD analysis is performed by allocating the zones where pressure is lower than the associated vapor pressure of water. Figure 2 presents a flow field visualization at the suction side of a centrifugal feeding pump impeller-diffuser arrangement where symptoms of vapor bubbles formation at the leading edges of vanes are shown [1].
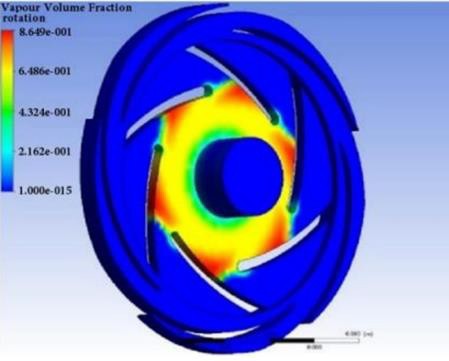
Figure 2. CFD Cavitation Zones Detection [1]
3 UofSC Digital Transformation Methodology #
The University of South Carolina is continuing the development of an end-to-end methodology, shown in Figure 3, that leverages computer aided design and manufacturing, sensing systems, data and physics-based models, fault prediction and diagnosis and data visualization to create a virtual asset management toolbox.
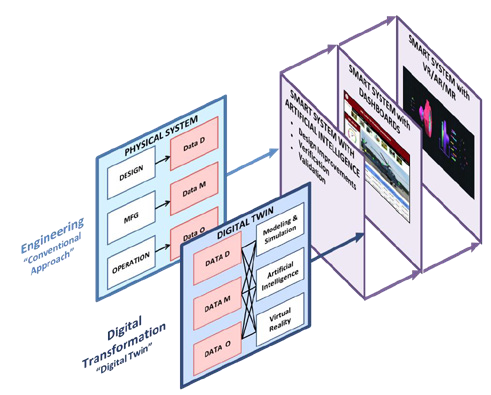
Figure 3. UofSC Developed Digital Transformation Methodology
Varying types of analysis can be performed to look at areas such as fault detection, prognostic/diagnostic algorithms, power usage metric, cost benefit analysis and fault analysis. This toolbox consists of cyber-physical systems to recreate a digital twin in any area of interest. This approach can be used to better maintain the integrity of processes and products at any stage of a component’s life cycle.
There are three types of data associated with a physical system: design, manufacturing, and operational. The data is collected and analyzed at the different stages of a systems life cycle and can be used to make various improvements. The data collected from the physical system is then used to create the digital twin of the system. In this stage of digital transformation, how the data is collected is important to consider. The optimal type, location and number of sensors needed must be identified.
When used in parallel, a physical system and digital twin create a smart system. This smart system can be useful in many areas from design improvements, verification, validation, monitoring, and even improved productivity. This smart system is key to digital transformation and is built on the data collected and models developed. In addition, a smart system can have many ways of displaying data depending on the need.
3.1 Use Cases for Validation #
The above methodology has been validated on use cases with application in multiple industries including:
- Healthcare: Digital transformation was used in the healthcare industry to address the need of monitoring premature infants. A framework for collecting infant data, conducting analysis in real-time, and presenting this information in easy-to-read dashboards was developed.
- Automated Fiber Placement: The application of digital transformation to the AFP machine was needed to enhance capabilities, refine processes, and create overall improvements. The developed use case demonstrates a framework for applying new technology to legacy equipment and addressed problems in the areas of data collection and modeling, training, and fault detection. Digital transformation elements included augmented and virtual reality, machine learning, and thermal modeling.
- General Machinery (Apache Gearbox): This use case showcased the flow of data from collection to analysis to presentation. The data collected includes sensor data such as vibration, temperature and torque, logistical data from maintenance records and manuals, and human knowledge from past experiences. This data is then analyzed with the intermediate gearbox model to create predictions and recommendations on the gearbox. The analysis is presented in the form of custom dashboards that are tailored to fit the needs of different users.
-
4 Application of Digital Transformation to Water Desalination #
Digital transformation can be used to address the challenges faced with fault detection of components in the water desalination plant. For this use case, the focus will be on a single component of a single system – the high-pressure pump found in the reverse osmosis system. Elements of the digital transformation used will include digital twins, machine learning, and interactive dashboards.
4.1 Physics-based Digital Twin of High-Pressure Pump #
Digital twin is the virtual representation for the physical systems. This virtual representation can be representing the physical system dynamics and the products [12]. The digital twin can achieve based on one digital model or combination of digital and mathematical models, such as computational fluid dynamics, finite element analysis, thermodynamics, kinematic, dynamic, and machine learning models. These models can be simulated or experimented with real-world data [14]. The digital twin is used to simulate and generate data under healthy environmental and harsh conditions and properties, shuffling these generated data with the real-world collected data to improve the digital twin accuracy. Using digital twin helps decision-makers better understand the system and improve and optimize the design, manufacture, health monitoring, and performance. Digital twins can also be used in predictive maintenance by generating sets of faulted data under different harsh conditions and integrating them with machine learning and real-time control algorithms to teach the physical system to detect and classify the faults in real-time and react accordingly to each type of failure. Augment digital twin model in the predictive maintenance area aims to predict and prevent future faults from occurs [1]. In our research paper, the machine learning model and saw-tooth model will be integrated together to detect cavitation and implement more unsupervised algorithms to the machine learning model to generates several faults data sets and classify the fault severity. For example, our use case in this paper is the cavitation fault the machine learning model will be able to classify what type of cavitation based on the location of bubbles implosion, the location of the cavity inception, and the difference in the frequency range. After integrating the HPP digital model together and achieve HPP digital twin move forward to the following water desalination system components such as the RO membranes to the next element. When each component has its own digital twin, start to connect all these digital twin models to achieve a smart water desalination plant; after that, it combines more than one plant to be monitored from one dashboard.
The following are the steps to build a digital twin:
- Understand the physics that governs the operation of the physical system (pump)
- Determine the input/output variables (that can be measured) and the design parameters that control the performance
- Build physics-based digital models to simulate the pump behavior under healthy environmental and harsh conditions and to detect and predict the future faults.
- Interconnect the physical system (pump) and its digital models
-
4.1.1 Models of Cavitation Pressure Pulses in Centrifugal Pumps
The paper presents two different fault detection digital models one using the saw-tooth model that can express the excitation of the centrifugal pump under cavitation with Fourier expansion and describe the periodic function with combination of sine and cosine waves instead of transfers the real-world data from time domain to frequency domain which made this model more cost and time effective. As the pressure pulses within the diffuser tongue region can be modeled as a sawtooth wave, each pressure pulse acts on the blade’s projected area, resulting in a periodic exciting force on the rotating impeller. Each blade projected area has a zero value at both the beginning and the endpoints of the blade-diffuser interaction region. Therefore, it can also be approximated in terms of another saw-tooth wave. The saw-tooth digital model was successfully integrated and tested with the physical system, and it showed its accuracy, as shown in the section below. The second cavitation detection model is a machine learning model that integrated three machine learning algorithms– the support vector machine, k-nearest neighbors, and logistic regression. The data analysis is based on millions of real-world historical data points that are processed from mounted sensors on the physical system, the data were mainly collected from six different parameters vibration sensors, dynamic and static pressure sensors, and flow rate sensors. Based on this machine learning model, potential cavitation faults are successfully classified and recognized, ensuring 99.5% prediction accuracy after preprocessing and training 80% of these data sets and testing the 20%.
Pressure pulsations developed due to cavitation in centrifugal pumps were investigated experimentally by several researchers [2, 3]. It was reported that interaction between impeller blades and the diffuser results in pressure pulsations dominated by the Blade Pass Frequency (BPF) times the number of diffuser tongues [2, 4]. These pressure pulsations are converted into periodic force pulsations affecting the rotor as well as the casing of the pump through the impeller projected area. Ref. [1] presented an illustration that describes how blade-diffuser tongues interaction causes sudden changes in pressure over each blade. This sudden change in pressure is repeated five times which matches the number of diffuser tongues.
Equation (1) and Equation (2) presents the saw-tooth function that expresses the pressure pulses.
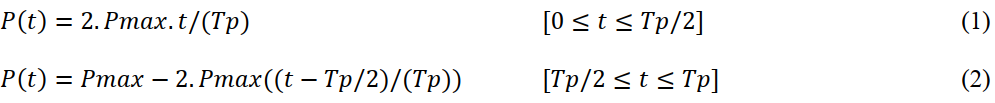
Where; 𝑃max is the peak value of the pressure pulse and 𝑇p is the period of the pressure pulse.
Equation (3) and Equation (4) presents the saw-tooth function that expresses the blade projected area.

Where; 𝐴o is maximum projected area of the blade. 𝑛𝑛 is the number of the diffuser tongues and 𝑁𝑁 is the rotational speed of the pump c.p.s. where the normalized saw-tooth pressure pulses as well as the blade projected area during one revolution (1/𝑁𝑁 = 0.02857 sec) respectively. Equations (1), (2), (3), and (4) are combined to determine the periodic force acting on each blade due to its interaction with the diffuser tongues during each revolution at the cavitation condition
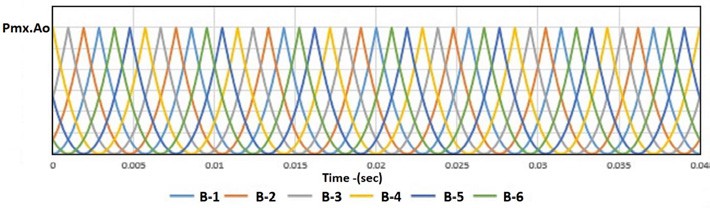
Figure 4. Normalized Forces on All Blades During One Revolution
Figure 4 depicts the normalized force pulsations on the six blades of the impeller, assuming that the first blade of the impeller is at a zero-degree angle and the six blades are equally spaced at 2𝜋𝜋/6 rad (60-degree angle).
The summation of normalized forces on the six blades in time domain and frequency domain are shown in Figure 5 and Figure 6 respectively. The major frequency observed at 1050 Hz corresponds to the blade pass frequency (BPF) (6 x 35 Hz) times the number of diffuser tongues. It is worthwhile to note here that results of this pressure pulsation model agrees with experimental results obtained in [2, 4].

Figure 5. Time Domain of Net Pressure Forces on All Blades During One Revolution
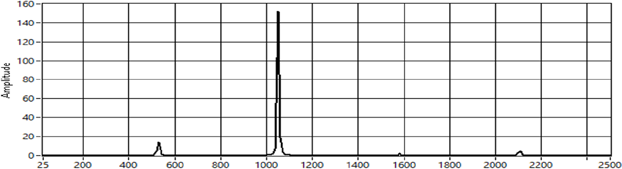
Figure 6. Frequency Domain of Net Pressure Forces on All Blades During One Revolution
4.2.1 Investigating the Vibration Response of Centrifugal Pumps Under Cavitation Condition
Models are derived to describe the vibration response of the rotor as well as the casing of feeding centrifugal pump under cavitation condition.
Equation (5) depicts the forced vibration of the rotor in matrix form.
![]()
Where; 𝑋(𝑡) is the state vector that expresses the rotor displacement in horizontal and vertical directions, 𝐶 is viscous damping matrix, 𝐾 is the stiffness matrix and 𝐹b(𝑡) is the periodic exiting force vector that results from the cavitation condition. Table 1 presents the main specifications of the rotor under consideration [1]. Effectively the periodic exiting force acting on the rotor, results from the summation of all forces acting on each blade of the impeller. Accordingly, the horizontal component and the vertical component of the resultant force vector are given by Equations (6) and (7) respectively.
| Part | Specification |
| Impeller | Mass=0.507 kg |
| Motor Rotor | Mass=2.264 kg |
| Motor fan | Mass=.04 kg |
| Rotor | Length=0.251 m |
Table 1: Rotor Main Specifications
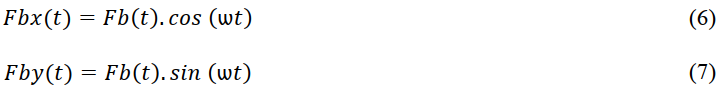
Figure 7 and Figure 8 presents the normalized horizontal and vertical exiting force components on the six impeller blades in time domain and frequency domain respectively.
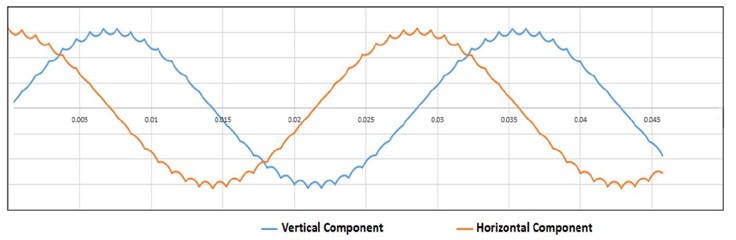
Figure 7. Normalized Exiting Force Components of Pump Rotor Under Cavitation Fault
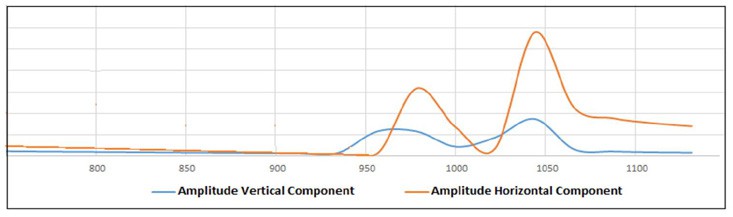
Figure 8. Normalized Exiting Force Components of Pump Rotor Under Cavitation Fault Figure 9 depicts the rotor response to the periodic exiting vertical force component under cavitation condition.

Figure 9. Pump Rotor Response to Periodic Pressure Force Vertical Component
The pump casing can be treated as a pressure vessel subject to periodic internal radial force resulting from the pressure waves of vapor bubbles collapse under the cavitation condition. In this case, the periodic internal force is determined by the pressure pulses times the casing internal surface area. The frequency of this periodic internal force corresponds to the number of impeller blades times the number of diffuser tongues times the synchronous frequency. Physically this frequency expresses the number of pressure pulses resulting from the total number of blade-diffuser tongues interactions per one revolution.
A simple state space model that describes the vibration of the pump casing is given by Equation (8).
![]()
Where, 𝑀c is the mass of the casing, 𝐾c is the stiffness of the casing and 𝑞(𝑡) is the displacement. 𝐹c(𝑡) is the periodic internal exiting force that can be determined by multiplying the pressure pulses function of Equations (1) and (2) by the internal surface area of the casing. To investigate the vibration response of the casing, one approach is to integrate equation (8). In this case 𝐹c(𝑡) is expressed in time domain using Fourier expansion where 𝐹c(𝑡) is decomposed into the sum of harmonic functions whose frequencies are multiples of the exiting force frequency. Equation (9) depicts the Fourier expansion expression of 𝐹c(𝑡).
![]()
Where: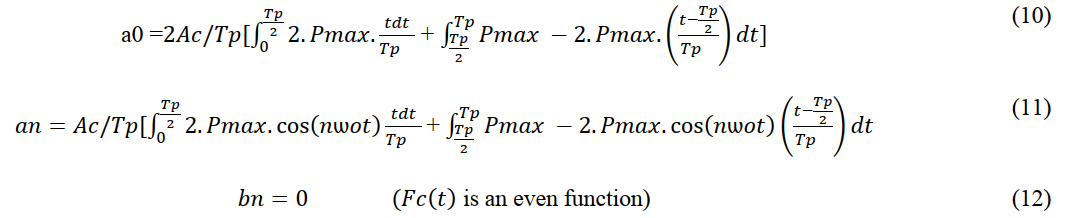
Figure 10 presents the time domain of the normalized steady state vibration response of pump casing. Figure 11 presents the frequency response of the pump casing subjected to the simulated periodic internal force due to cavitation.
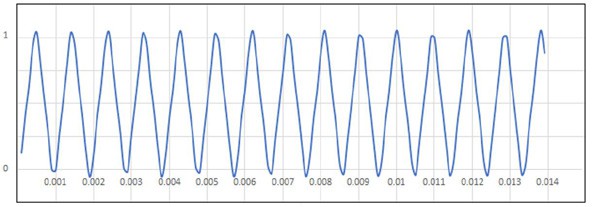
Figure 10. Normalized Steady State Vibration of Pump Casing
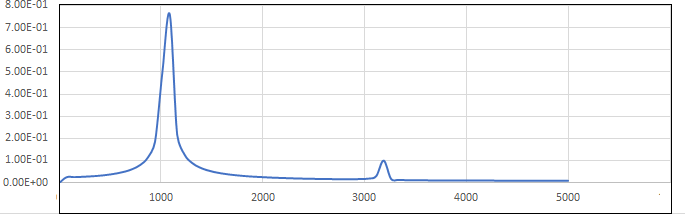
Figure 11. Vibration Response of Pump Casing
The main vibration frequency is 1050 Hz which corresponds to synchronous frequency times the number of blades times the number of diffuser tongues. This result indicates that the developed pump casing model governed by Equations (8) through (12) has detected the vibration of the casing due to the pressure pulses generated by the cavitation.
The centrifugal pump is a hydraulic turbomachinery that continuously transfers energy to the feed water in a desalination plant. The longevity of centrifugal pumps depends on proper maintenance and early faults detection. In this case study, cavitation in centrifugal pumps is considered. Mathematical models that express pressure pulses as well as the resulting exiting periodic forces were developed. Digital models describing the vibration response of pump rotor and casing under cavitation periodic excitation were tested for a typical small feeding centrifugal pump. Power Spectrum analysis was conducted to present the frequency response characteristics of pump rotor and casing. The dominant detected vibration frequency was 1050 HZ which corresponds to the synchronous frequency times the number of impeller blades times the number of diffusers tongues such results are in agreement with previously published work as well as actual vibration measurements.
4.1.2 Using Machine Learning models in fault detection
Regarding the trendy automatisms and working in an uncertain, evolutionary environment the current industrial plants and systems become more and more mechatronics complex [13]. The classification and detection of the mechanical system faults is an essential task for a reliable operation. As mentioned above cavitation is one of the most disadvantage problems that occurs frequently in the centrifugal pumps Fault detection using Machine learning algorithms attracted much attention this decade because it is a powerful, fast, computational method that can detect the centrifugal pumps faults efficiently [10, 11]. Fault detection using machine learning has been a promising technique of releasing the human labor contribution as it is recognizing the machines health state automatically [14]. The ML model is integrated three machine learning algorithms:
- SVM: is a supervised classification and regression learning algorithm that has strong linear, nonlinear and kernel generalization ability functions. The goal of the algorithm is to create a hyperplane boundary between the possible outputs to separate them into the correct categories. Any new data point can be easily put in the correct category using the hyperplane. SVM algorithm trains different real-world historical data and can efficiently detect cavitation with high accuracy and excellent performance.
- KNN: is a supervised classification learning algorithm and one of the simplest ML algorithms that help in fault detection. KNN algorithm assumes the similarity between the data and puts them into the most similar category to the available categories. KNN has been applied before for different fault detection mechanical use cases, and it showed high accuracy and good scalability.
- Logistic Regression: is a supervised regression analysis method in which the outcome is binary or dichotomous using predictor variables. Logistic regression is also considered a supervised learning classification algorithm used efficiently in predicting the probability of a dependent variable. The model showed a high accuracy to detect the cavitation as it has been used to build predictive models as a function of predictors and because of the data linearity.
-
-
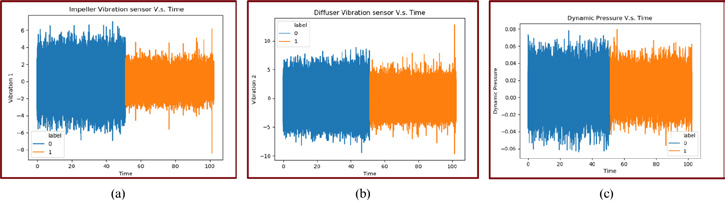
Figure 12. (a) and (b) Collected vibration data before and after cavitation, (c) Collected dynamic pressure data before and after cavitation
Parts a and b of Figure 12 represents the vibration data that have been collected from two vibration sensors one is mounted to collect the pump’s impeller vibration data and the second vibration sensor is mounted to collect the pump’s diffuser vibration data. The blue plots represent the data before cavitation exist and takes 0 label, where the orange plots represent the data after cavitation and takes label of 1. The vibration amplitude before cavitation was greater than after cavitation and these real-world collected results can be explained by studying the pressure pulsation data that was collected by using dynamic pressure sensor and represented in part c of the above figure. Part c shows that the dynamic pressure amplitude before the cavitation was greater than after cavitation because of decreasing in the exciting force magnitude affecting the pump’s rotor during the cavitation and this decreasing magnitude corresponds to the decrease in ∆𝑃 = (𝑃2− 𝑃1) [1]. Due to the bubble’s explosion at this point during cavitation 𝑃1 increase at this BPF frequency the spectral peak does not show any significant decrease from normal to cavitation condition [1].
Figure 13 shows three confusion matrices generated by three different ML algorithms the SVM, the KNN, and the Logistic regression. Confusion matrices represent the detailed algorithm performance in terms of true negatives (TN), true positives (TP), false positives (FP), and false negatives (FN). In the presented use case, 104,963 TP data sets were predicted successfully as cavitated data sets. In contrast, three FN data sets were falsely predicted as healthy data before the cavitation generates. Where 104,652 TN data sets were truly predicted as healthy data sets successfully, while 97 FP data sets were falsely predicted as cavitated data, however, it was not cavitated data sets. This SVM algorithm accuracy is > 99.5% however, the occurrence of 97 falsely predicted as faulty data sets was not acceptable because that can yield to an unplanned/spontaneous decision like shutdown the pump several times, which cause unstable water production and industry disturbance. The KNN algorithm improved the predicted data by decreasing the number of FP data sets; the algorithm is more accurate and efficient than the SVM model as it is more cost and time-efficient in detecting the cavitation faults. However, while the KNN algorithm was working on decreasing the number of FP data sets to 36% of the SVM model, the number of FN data sets increased, which is not acceptable as it means more cavitation data sets will exist without predicting them. Applying the logistic regression algorithm to reduce the two types of errors, the FP and FN detected data sets. The logistic regression algorithm was the most time-efficient model, and it supported the most accurate fault detection result with f1 accuracy of 99.996% because of the data linearity.
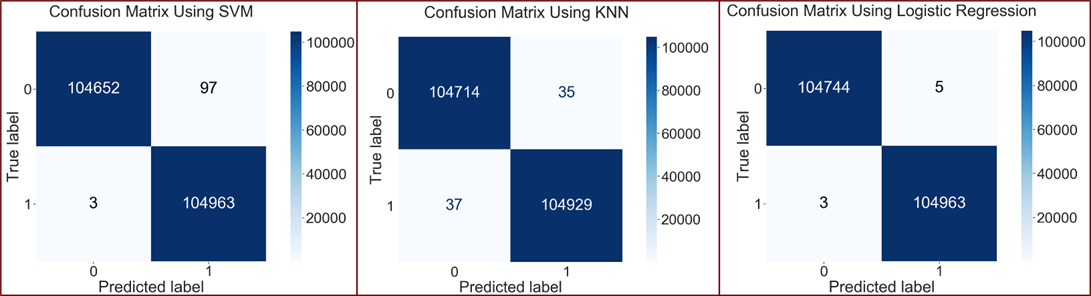
Figure 13: Confusion matrix using SVM, KNN & Logistic Regression
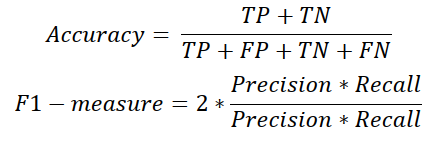
The machine learning models accuracy was calculated using the F1 score method. Different methods can calculate the accuracy of the three models; two methods are recommended for calculating the model accuracy and their equations are listed below. The accuracy method is more recommended when the machine learning models users are more attracted to the True Positives, and True Negatives detected points [15]. In contrast, the F1 score method is more recommended when False Negatives and False Positives are crucial. In most real-life classification problems, the F1 score method is applied because the imbalanced class distribution exists, and it is a better metric to evaluate the model [16]. The aim of using three different ML algorithms and comparing them with each other even with each model’s high accuracy, which exceeds 99.5%, is to combining these three models’ fault detection before making any decision that can affect the industry. For example, the SVM algorithm is one of the most robust classification algorithms that has been introduced and applied before on several fault detection problems on mechanical, hydraulic, and electrical components. However, SVM showed less efficiency than the KNN model, which was lower than the Logistic regression model in our cavitation detection case. SVM showed the existence of 97 false positives detected points and if the fault detection model depended on just one ML algorithm instead of the three ML models combined with the saw-tooth physical-based model, several false decisions would occur by the machine operators due to generated false alarms, which could affect the logistics, planning and disrupt the production systems by causing production delay.
4.2 Monitoring #
In the last decade identifying fault occurrence in time was a challenge not only in mechanical components but in several industrial components. These industrial components are subjected to different uncertain environmental conditions and damage caused by acoustic emissions, misbalance, misalignment, occasional shocks, poor power quality, supply imbalance, and vibrations, and the way it is handled, which can lead to unscheduled maintenance interventions which is difficult to perform and expensive [5, 8]. Nowadays with the development of the diagnostic abilities in the health monitoring area because of the enhancement of the sensor’s technologies, data driven techniques, big data analytics, data preprocessing, machine learning, signal processing algorithms, smart control, artificial intelligence, and the development of the computational power. Health monitoring advancing the evaluating and monitoring of the industrial systems by improving the systems reliability and life cycle management and avoiding machines shutdown for more periodic maintenance and breakdown time.O
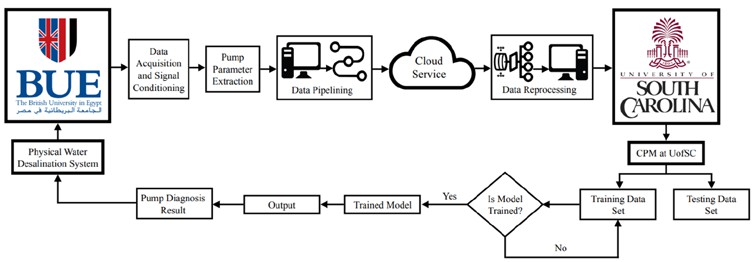
Figure 14. Implemented water desalination system status monitoring scheme for fault prediction
This approach is conducted by a joint team from the Center of Excellence in Predictive Maintenance (CPM) at the British University of Egypt (BUE) and the Center for Predictive Maintenance (CPM) at the University of South Carolina (USC), USA. The Egyptian team leads the part of designing and manufacturing and full integration of the small RO water desalination system equipped with onboard monitoring, data extraction and control system. Having the physical system in Egypt supported both teams with a solid understanding of the system’s physical behavior and properties, by monitoring the system under healthy and generated harsh conditions, collecting real-world data by employing adequate sensors and a data acquisition system that sensing and extracting the pump parameters such as static and dynamic pressure, flow rate, salinity, and vibration data. The US team develops an Industry 4.0 framework, including a digital twin of the system that will allow for self-diagnosis and system decision making to ensure optimal performance. These features enable remote monitoring and control of the desalination plant. The digital twin (DT) health monitoring system (HMS) receives data from onboard sensor monitoring critical variables of the plant in Egypt, train and compare these extracted measurements to the plant’s historical and theoretical models’ output. This enables the system to optimize its performance to achieve prolonged life predictions and better efficiency. The current health of the system will be updated in real-time and will be shared with a remote decision-making authority. If there is an anomaly in the readings, corrective action will be initiated, and responsible personnel would be alerted to the new state of the system. The Internet of Things (IoT) enables this interconnected network of machines and people and will enable the existence of a reliable, remotely operated, automated, decentralized SWRO water treatment plant in the desert.
4.3 Dashboards #
Dashboards allow for all processing, storage, and calculations to be conducted in one location. They also present the necessary information quickly and in an easy-to-understand format so that decisions are made with more knowledge and can yield better results. Once the fault detection models have been implemented, the analysis and results will need to be presented to allow users to quickly understand any problems and inform their decisions. Additional benefits of these dashboards are the ability to enhance training and facilitate knowledge transfer through simulating hands-on experience. A key part of these dashboards is that the information presented is customized and tailored to fit the needs of different users. Two sample views are shown in Figure 15. The left side shows a user the health status of the multiple water desalination plants they are overseeing, an executive might use this view to make decisions. The right side shows the health and status of a specific system and the fault detection analysis.
5 Conclusion #
The use case in Section 4 was only applied to a single component, a high-pressure pump, but digital transformation can be applied in stages. The lessons learned, framework, data, and algorithms developed when focusing on a single component can be expanded to cover the system and later the entire plant. Figure 16 shows the steps of expanding from high pressure pump to smart plant.
- Step 1: Apply Digital Transformation to a single component of a system in the plant such as the high-pressure pump of the reverse osmosis system.
- Step 2: All algorithms, models and techniques developed in Step 1 will be expanded and applied to all the components of the reverse osmosis system.
- Step 3: All algorithms, models, and techniques developed in Step 2 will be expanded and applied to the remaining systems of the plant.
- Step 4: Expand the application of digital transformation to a network of smart plants allowing users to monitor both individual plants and the interactions between plants.
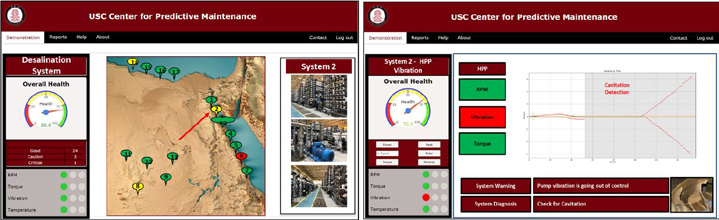
Figure 15. Dashboard Views
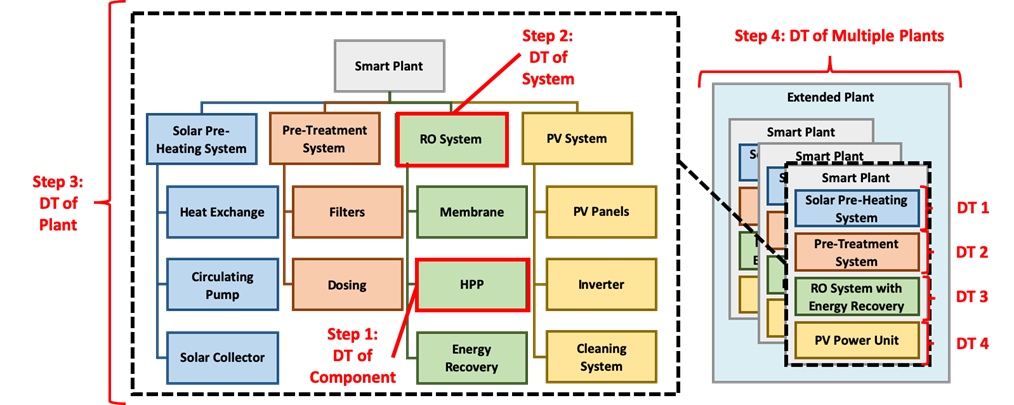
Figure 16. Incremental Application of Digital Transformation
References: #
- Amr A. Abdel Fatah, M.A. Hassan, M. Lotfy and Antoine S. Dimitri “Using Digital Models for Condition Based Maintenance of High-Pressure Pumps in SWRO Desalination Plants”, ASIA Turbomachinery & Pump Symposium,12-15 Singapore, (2018).
- Kim, M. J., Jin, H. B., and Chung, W. J., “A Study on Prediction of Cavitation for Centrifugal Pump,” International Journal of Mechanical, Aerospace, Industrial, Mechatronic and Manufacturing Engineering Vol: 6, No:12, (2012).
- Lu, J., Yuan, S., Parameswaran, S., Yuan, J., Ren, X., and Si., Q., “Investigation on the vibration and flow instabilitie s induced by cavitation in a centrifugal pump,” Advances in Mechanical Engineering, volume 9, pp. 1-12, (2017).
- Amr A. Abdel Fatah, M.A. Hassan, M. Lotfy and Antoine S. Dimitri” Health Monitoring of Centrifugal Pumps Using Digital Models” ASME, Journal of Dynamic Systems and Control, Vol.141 / 091014-1, (2019).
- HS, Ranganatha Chakravarthy, Sai Charan Bharadwaj, S. Umashankar, Sanjeevikumar Padmanaban, Nabanita Dutta, and Jens Bo Holm-Nielsen. “Electrical fault detection using machine learning algorithm for centrifugal water pumps.” In 2019 IEEE International Conference on Environment and Electrical Engineering and 2019 IEEE Industrial and Commercial Power Systems Europe (EEEIC/I&CPS Europe), pp. 1-6. IEEE, (2019).
- Saidy, Clint, Kaishu Xia, Anil Kircaliali, Ramy Harik, and Abdel Bayoumi. “The Application of Statistical Quality Control Methods in Predictive Maintenance 4.0: An Unconventional Use of Statistical Process Control (SPC) Charts in Health Monitoring and Predictive Analytics.” In Advances in Asset Management and Condition Monitoring, pp. 1051-1061. Springer, Cham, (2020).
- Dutta, Nabanita, S. Umashankar, VK Arun Shankar, Sanjeevikumar Padmanaban, Zbigniew Leonowicz, and Patrick Wheeler. “Centrifugal pump cavitation detection using machine learning algorithm technique.” In 2018 IEEE International Conference on Environment and Electrical Engineering and 2018 IEEE Industrial and Commercial Power Systems Europe (EEEIC/I&CPS Europe), pp. 1-6. IEEE, (2018).
- Zou, Y., Tong, L. P. S. G., & Steven, G. P. Vibration-based model-dependent damage (delamination) identification and health monitoring for composite structures—a review. Journal of Sound and vibration, 230(2), 357-378, (2000).
- Shi, W., Wang, C., Wang, W., Pei, B., “Numerical Calculation on Cavitation Pressure Pulsation in Centrifugal Pump,” Advances in Mechanical Engineering, volume 6, pp. 1-8, (2017).
- Bode, Gerrit, Simon Thul, Marc Baranski, and Dirk Müller. “Real-world application of machine-learning-based fault detection trained with experimental data.” Energy 198, 117323, (2020).
- Liu, Shuping, Cauligi S. Raghavendra, Yintao Liu, K.Yao, Oluwafemi Balogun, Lanre Olabinjo, Ram Soma et al. “Automatic early fault detection for rod pump systems.” In SPE annual technical conference and exhibition. OnePetro,(2011).
- Schweigert-Recksiek, Sebastian, Jakob Trauer, Carsten Engel, Karsten Spreitzer, and Markus Zimmermann. “Conception of a Digital Twin in Mechanical Engineering–A Case Study in Technical Product Development.” In Proceedings of the Design Society: DESIGN Conference, vol. 1, pp. 383-392. Cambridge University Press, (2020).
- Lo, Ndeye Gueye, Jean-Marie Flaus, and Olivier Adrot. “Review of machine learning approaches in fault diagnosis applied to IoT systems.” In 2019 International Conference on Control, Automation and Diagnosis (ICCAD), pp. 1-6. IEEE, (2019).
- Boschert, Stefan, and Roland Rosen. “Digital twin—the simulation aspect.” In Mechatronic futures, pp. 59-74. Springer, Cham, (2016).
- Hossein Javaheri, Sadaf. “Response modeling in direct marketing: a data mining-based approach for target selection.” (2008).
- Chicco, Davide, and Giuseppe Jurman. “The advantages of the Matthews correlation coefficient (MCC) over F1 score and accuracy in binary classification evaluation.” BMC genomics 21, no. 1:1-13, (2020).


