


MSc ETH Daniel Pfammatter, PhD ETH Patrick Escher, MSc Shima Fahima
Easy Energy Companies & Consulting SA, Switzerland, info@eecc.swiss
Abstract
This paper focuses on the relationships between the maintenance of existing assets, and opportunities given by rapidly advancing digitalization.
Performance diagnostics throughout the life cycle is of high relevance for controlling the operation and maintenance of power and process plants. Monitoring systems based on gas path analysis can make a considerable contribution to the enhanced availability of turbomachinery. In order to carry out performance diagnostics, an accurate thermodynamic model has to be specified. Building a precise model for different types of turbomachines requires an exact layout of the turbine.
The exploitation of the potential given by predictive algorithms, new (Internet of Things) IoT devices, higher measurement capacities, digital twin, and big data techniques are valid options to improve the performance and reduce costs and risks simultaneously of any existing asset under periodic maintenance schedule and actions by minimizing CAPEX investment to expand and adapt the infrastructure and maintaining limited OPEX operating costs.
An innovative, suitable solution is technically introduced and financially evaluated.
Keywords: Asset management, maintenance, power generation, gas path analysis, smart grid integration, Internet of Things (IoT), real-time controls, Big Data analytics.
1 Introduction #
Performance Monitoring & Diagnostics Analytics not only mirrors the operating environment digitally but provides the basis for better decision-making at every level of plant and fleet operation.
In order to carry out performance diagnostics, an accurate thermodynamic model has to be specified. Building a precise model for different types of turbomachines requires an exact layout of the turbine. In particular, for each engine type layout data and engine design parameters have to be specified.
The present study describes the individual phases for conducting performance diagnostics using the gas path analysis method for a specific gas turbine. It shows how design data are modeled, component characteristics of compressor and turbine specified and instrumentation data assessed. Furthermore, the study demonstrates how additional reengineering is carried out in order to achieve an adequate thermodynamic model of the gas turbine. The implications of the results for applying this performance diagnostics technique to turbomachines are discussed.
In the past, as the operation and maintenance regime was dictated by the manufacturers the only approach was to reduce the cost of replacement parts. However, as recent fuel prices and the pressure to improve return on investment for the new owners increase, management has to look at more innovative ways to reduce costs. They are more willing to explore newer technologies in replacement parts which often offer longer component life and therefore achieve not just cost reduction but also more revenue generation by reducing plant shutdown periods and/or increasing the time between overhauls. However, particularly for managers who are unused to such ventures, these projects can be fraught with risks. Under these conditions, operators of turbomachinery power plants need to constantly assess the health state of the turbine components. Based on measurement data they can take appropriate actions to reduce maintenance costs and increase the reliability of the turbomachinery components.
Machines are the primary assets of production in a power plant. Condition monitoring and fault diagnosis can provide sufficient advanced warning of impending faults so maintenance can be cost-effectively planned ahead of time. For each type of machine, advanced analysis methods can be used to reliably detect and diagnose the relevant faults as early as possible.
This paper presents an approach based on gas path analysis for the diagnosis of the performance of single-shaft gas turbines. Data from an actual case study is used for illustration. The presented results are a 70MW gas turbine, single shaft, and with a constant speed 50Hz generator. Based on several hundred data sets of monitored quantities the gas turbine model is established and the health indices for the different components are derived.
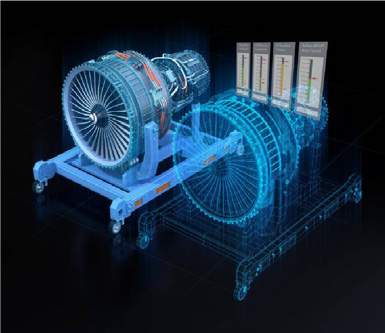
2 Digital Twin Technology #
“Real-time access to data and intelligence is driven by the continuous and cyclical flow of information and actions between the physical and digital worlds.” (6)
“Digital twin refers to the mapping of the physical asset models in a digital platform, where a virtual digital replica model is created.” (7)
A lot of computational physics-based and analytics-based models are housed in the virtual model to analyze and forecast the health and performance of operating assets over their lifetime. This allows the operator to understand the operations of the asset and prevent unexpected failures.
Through this paper, we introduce “Delphys” digital twin product as a performance monitoring & diagnostics analytics system for rotating equipment. The state-of-the-art tool provides so-called health indices for improving operation and switching from preventive to conditioned-based maintenance.
The proposed digital twin solution “Delphys” links the monitoring and diagnostic center(s) infrastructure to remotely evaluate the plant’s key performance indicators (KPI) through a daily operation.
Delphys enhances big data analytics and large-scale network infrastructure that will provide value for power plant insurers and power plant owners from many perspectives such as fewer unplanned outages, more refined maintenance strategies, and better-managed asset life.
The following figure shows the overall architecture of the proposed technology.
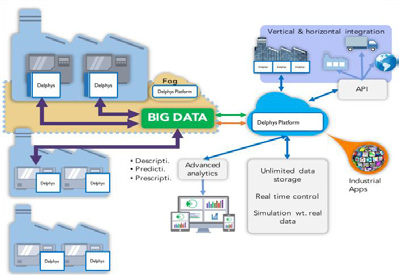
The overall architecture of applied digital twin for critical infrastructures.
2.1 Core Technology #
Core technologies of Delphys are Gas Path Analysis, Neural Network, and Data Validation. Gas Path Analysis (GPA) is a mature technology for aero engines and is now made ready to use for heavy-duty gas turbines. GPA is a mathematical
sensitivity analysis of the component maps that works based on a physical model of the gas turbine engine and actual measured values. The physical model of the gas turbine is equipped with component maps and is able to represent the engine at any operating point and under any ambient conditions of interest.
A major advantage of GPA is the calculation of deteriorated maps. This allows describing the actual performance of the analyzed gas turbine. Key figures for describing maps will quantify degradation such as compressor fouling, turbine erosion, etc.
2.2 Maintenance #
2.2.1 Approaches
The idea that performing preventive maintenance1 on a pure, fixed time-based schedule is increasingly losing support amongst the utility maintenance managers, as the appliance of the so-called reactive maintenance2 approach bears high risks and eventually prohibitive costs due to the unavailability of the power supply.
The introduction and the adoption of a predictive maintenance3 attitude have become interesting in recent years and will increasingly be taken into consideration as a new approach in the next future. Although the predictive approach has a great potential for optimizing the expenditures and the availability of the power plant, the current application is in many cases difficult: the lack of specific diagnostic software and specific operational data to be used for evaluation of abnormal conditions, the delay in the adoption of the concept by manufacturers and the resulting adaptation of the warranty conditions act as a brake.
2.2.2 Future methods
As a precise evaluation, i.e. on factual data, of the actual condition, is not always possible, the specific technical knowhow and the experience of specialized service providers, having access to the largest amount of specific data become indispensable when trying to undertake the transition toward predictive maintenance strategy.
2.3 Security #
The security architecture is designed to address cyber security regulations, ensuring data availability, validity, and integrity based on a distributed approach that attempts to bring the most effective detection mechanisms and tools together with correlation and anomaly detection analysis techniques, in order to create a solution that starts with the state of the art in Critical Infrastructure security as its baseline and dealing with unknown threats, by incorporation of machine learning anomaly detection features.
3 Gas Turbine Modelling #
To reduce the operational costs of an electrical power plant it is of important to know the actual and future conditions of the components, especially for rotating equipment like gas and/or steam turbines. While conventional monitoring systems allow for assessing the actual state of operation only, model-based approaches like gas path analysis (GPA) can be used for a detailed diagnostic of the plant as a whole or for individual components like compressors and turbines. As operating conditions vary over time, the model-based GPA technique enables comparison and analysis. GPA is used to distinguish the so-called health conditions of the main components from the overall performance of the entire gas turbine
GPA (model-based) in combination with knowledge-based diagnostics tools (e.g. filter condition) is applied for thermodynamic monitoring of the working fluid leading parts. In order to apply these models properly, data validation of the measured signals is of vital importance.
1 The preventive approach assumes that the components deteriorate in line with the expected degradation rate and undergo maintenance at different levels after a given elapsed time or hours of operation. It may result in either unnecessary repairs, or catastrophic breakdowns.
2 The components are only fixed when they break down: the safety margin between planned and highly probable wear-out failure is disregarded and higher risks are accepted. This approach implies the management of more or less extensive spare parts inventories, the availability of fast-reacting skilled labours, as well as the acceptance of long-lasting plant outages, loss of production and possibly higher costs for expedited shipments.
3 Several different indicators and parameters are directly measured, monitored and evaluated to assess through factual data the actual operating conditions of the components and to offer diagnosis of issues of different nature. This approach aims at determining the actual time-to-failure by judging the mechanical and functional conditions of the critical equipment: the safety margin is evaluated and the maintenance activities can be optimized on an as-needed basis.

Fig. 1: Overview layout gas turbine and used methods for the monitoring system.
For modeling the specific gas turbine, operation characteristics of the components, i.e. filter, compressor, and turbine, are represented in the monitoring system. Data validation based on filter analysis and gas path analysis allows refinement of the modeling of the plant. In the following, the procedure for data validation is described and the required data input from filter analysis and gas path analysis is stated. With the methods of filter analysis, gas path analysis, and data validation, a monitoring system is a set-up that allows performing necessary reengineering of the plant in order to gain diagnostics data that are relevant for optimizing operation and maintenance.
3.1 Data Validation #
Measuring and data collection require that all relevant measurements and indicators which describe the conditions are identified. The necessary sensors have to be available or installed. In regular intervals, data is measured. Some preliminary validation of the sensors (e.g. Fast-Fourier-Transformation) may be performed. Finally, the data is transferred to a central server, where it is stored for later use. To facilitate fault detection, data is pre-processed: Outliers are removed and data is normalized to cancel the effects of environmental and contextual attributes. Limits or thermodynamic rules may be used to validate sensor values. If data from a particular sensor is inconsistent with the rest of the system, it points to a possible sensor failure. As a consequence, data from that specific sensor are ignored and replaced by a set of model-generated values. New parameters are created based on the composition of existing values. The most relevant sub-set of parameters is then selected and trended over time. For fault detection, the current values and trends of the parameter subset are then compared against standards (e.g. ISO 10816 (2)), thresholds, and/or model- predicted values.
3.2 Filter Analysis #
Filter houses are typically equipped with pressure drop sensors. As these values are not only dependent on the degree of fouling, but also on mass flow changes, engine load has to be considered. This can be achieved by combining the filter pressure drop, power output, and inlet guide vane position into a single filter characteristic. As a result, a filtered index is derived that has a value range of 0 to 100%, i.e., 100% indicating that the filter is running at the ideal point, and lower numbers indicating that the filter has deteriorated.
3.3 Gas Path Analysis #
During the operation of a gas turbine (GT), measurement data are taken with appropriate sensors. Data are typically filtered and averaged. The GPA method is based on a mathematical sensitivity analysis of the component characteristics.
The results of GPA are the so-called „Health Indices “(HI). In the case of a single shaft GT with the appropriate measuring system four indices can be calculated (cf. Table 1):
Table 1: Description of Health Indices
| Health Index | Description |
| Compressor Flow Capacity | Change of non-dimensional mass flow through the compressor |
| Compressor Efficiency | Change of the compressor efficiency |
| Turbine Flow Capacity | Change of non-dimensional mass flow through the turbine |
| Turbine Efficiency | Change of the turbine efficiency. |
The ratio of the various Health Indices over time can accurately locate a faulty component such as a compressor or turbine. With the derived ratios, GPA is able to diagnose physical faults such as fouling, erosion, etc.
3.4 Model Reengineering #
A gas turbine is modeled with an analytical performance model, which is based upon component characteristics and aero-thermal relationships, such as the laws of conservation of energy and mass. The calculation then proceeds to “match” all of the components by satisfying the aero-thermo relationships. Assuming that the component characteristics are accurately defined, the model can assess the engine performance in terms of measurable parameters such as pressure, temperature, etc., and in terms of non-measurable parameters such as efficiency, flow capacity, etc. The non- measurable parameters describe the characteristics of the components such as the compressor, turbine, etc.
If component characteristics are not available, reengineering is necessary. This can be done for a sufficient range of operations according to data from the GT acceptance test and/or the collection of stationary measurement data with calibrated sensors at different engine loads (e.g. 80%, 90%, and 100%).
For a single-shaft gas turbine, the creation of component characteristics can be done as follows:
- By using data from measurements (power output, compressor outlet temperature and pressure, turbine outlet temperature).
- By using calculated data (that correspond to measurements) from performance calculation with assumed component characteristics.
- By viewing differences of calculated and measured data over inlet guide vane, over ambient pressure and over ambient temperature.
- With engineering know-how, by adjusting the component characteristics according to the shown differences.
4 Case Study #
The base of GPA is the thermodynamic model of the gas turbine. For the particular engine in the case study (70MW single shaft gas turbine with electrical generator) the following measured data are available:
- Ambient conditions (pressure, temperature, and relative humidity)
- Pressure loss over the inlet filter
- Position of variable inlet guide vane
- Pressure loss of the combustion chamber
- Fuel volume flow
- Active generator power
- Pressure after the compressor
- Temperature after the compressor
- Exhaust temperature
- Lower heating value (monthly averaged).
4.1 Data Validation #
A typical set of data from a large single-shaft gas turbine is averaged every 30 minutes. Since these data are used for generating the gas turbine performance model, sensor validation analyses have been performed in advance of setting up the model, i.e. measurement results of redundant sensors are compared, and sensor results are analyzed for their plausible range and correct sampling.
4.2 Data Acquisition #
Usually, for gas turbines of this size, the measurement equipment is suitable for the data to be taken from the standard engine acquisition system and applied as input data for gas path analysis calculations. However, in our case study, although this particular engine was well equipped, an inappropriate storage frequency had been chosen, resulting in a considerable amount of useful data being discarded. This was remedied at the next overhaul of the gas turbine (cf. Fig. 2 and Fig. 3).
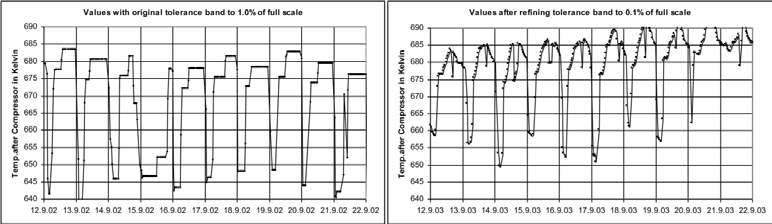
Fig. 2: Refining tolerance band data acquisition, an example of temperature after compressor
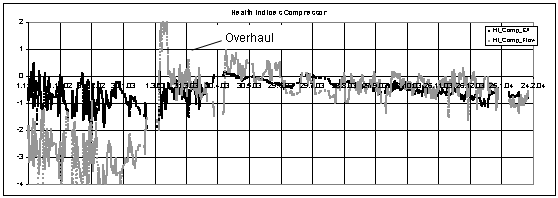
Fig. 3: GPA results for health indices of compressor after refining tolerance band of measurement data
4.3 Operating Point Steadiness #
The operating point of a gas turbine power plant is seldom at design values. A common varying parameter is a load that can fluctuate. Also, some parameters respond relatively faster than others to a single event, for instance, pressure will rapidly adjust to the new state whereas temperatures take more time to settle. For performance modeling, averaged measurements (over a period of 30 minutes) were investigated from the standpoint of steadiness, i.e. only values were used where the measurements within the averaging process do not differ from each other by an assumed range of 0.2%.
4.4 Ambient temperature #
The inlet temperature of the compressor is taken from three measurement signals. Figure 4 shows the temperature measured in front of the gas turbine compressor over the ambient temperature. For this particular application, at temperatures below 10° Celsius, operating points, where the air preheater is switched on to prevent icing, can be identified. Since this behavior affects the model of the GPA, health indices were not calculated while the air preheater was switched on (cf. Fig. 4).
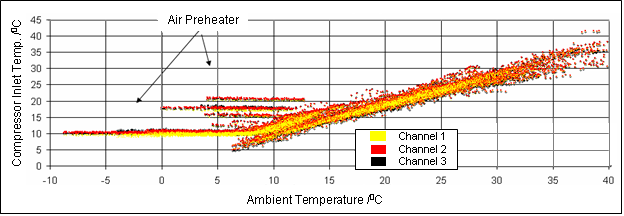
Fig. 4: Temperature before compressor over the ambient temperature
Differences between the three measured temperatures at the inlet of the gas turbine compressor are shown over ambient temperature (cf. Fig. 5). At ambient temperatures higher than 10° Celsius, measurement errors of the sensor are discernible. These errors can be minimized by calibrating and averaging the sensor signals. Data at ambient temperatures below 10° Celsius are ignored. It can be assumed, that the inlet air is not uniformly heated by the air preheater.
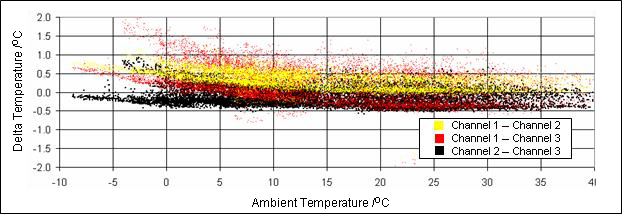
Fig. 5: Differences of compressor inlet temperature sensors over the ambient temperature
4.5 Relative Humidity #
Unreliable relative humidity measurement can influence the health indices of the GPA as follows: an assumed error of relative humidity of 20% can change the health indices at an ambient temperature of 25° Celsius by 0.5% and at an ambient temperature of 15° Celsius by 0.2%.
4.6 Variable Inlet Guide Vane #
The position of variable inlet guide vanes is a major contributing factor to engine mass flow and engine power. Accurate measurement is essential for modeling and diagnostics. Accuracy is attained by calibration and averaging with multiple sensors.
4.7 Lower Heating Value #
Although a fuel flow measurement in combination with the lower heating value was a promising basis for thermodynamic engine diagnostics, the averaging process of the heating value introduced a great degree of uncertainty into the GPA process (cf. Fig. 6). Since the monthly averaged values vary by about 1% and the daily values are unknown, heating value and fuel flow are not used in the modeling of the gas turbine with GPA. An engine regulation function giving a calculated turbine inlet temperature is used instead.
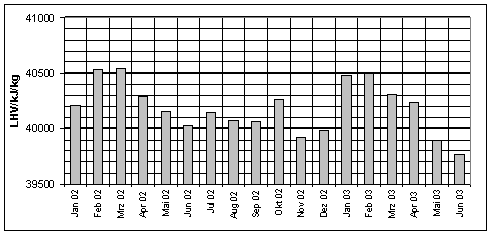
Fig. 6: Monthly averaged lower heating value
4.8 Turbine Inlet Temperature #
Variable guide vanes of compressor and turbine inlet temperature are the key to setting the operating point in the performance calculation. In many cases, the turbine inlet temperature is not measured. To overcome this problem, assumed turbine efficiency in combination with other measured parameters is used to deduce a function for the turbine inlet temperature over the engine load.
4.9 Filter Analysis #
Conditions of the air intake filters are derived from the filter index (as described above). Figure 7 shows how the system performance is affected by the status of the filters, e.g. as they deteriorate over time and when they are replaced.
Independent from the load, the status of the filter can be shown. In the investigated case, heavy contamination of the filter was observed within a short period due to natural and anthropogenic environmental impact.

Fig. 7: Filter analysis
4.10 Gas Path Analysis #
Modeling a gas turbine engine means setting up correct component maps. During the process of setting up this model, the accuracy is tested over the operating range of interest. A useful method is to compare the relative deviation of measured and calculated values, i.e. power, compressor inlet pressure, compressor inlet temperature, and turbine outlet temperature (cf. Fig. 8). This method is aimed at keeping deviations constant and load-independent. Offsets can easily be corrected in the following gas path analysis.
Component characteristics for the performance calculation are adjusted with results from measured values.
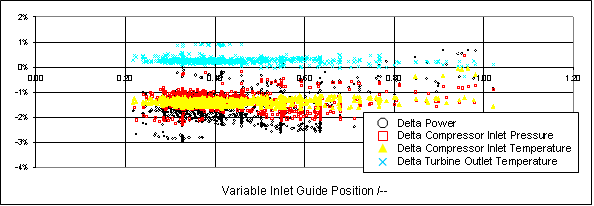
Fig. 8: Differences of specified values over variable inlet guide vane to derive component characteristics
With the engine model set up the methodology of gas path analysis was applied for new sets of measurements.
The resulting GPA health indices (cf. Fig. 9) show, that the compressor and turbine experience no physical fault (such as fouling or erosion). For a short period of time, a faulty sensor caused the health indices to overshoot values up to 4%. A normal running condition can be described by health indices in the range of 1% taking into consideration that the input values are filtered and averaged with respect to outliers, steadiness, and engine operation range.

Fig. 9: GPA results with partly faulty sensors
Figure 10 describes the GPA health indices before and after an overhaul and the corresponding power output, measured and normalized to design ambient conditions. In addition, a root means square (RMS) value is calculated with the health indices in order to estimate the magnitude of the physical fault. Before the overhaul, the compressor indicated fouling,
i.e. ratio of mass flow change to efficiency change = 4:1 (3). After the overhaul, clean performance was found to be recovered. Despite periodic and intensive washing cycles of the compressor, the compressor experiences slight fouling
over time, which can be accounted for to the non-recoverable performance losses. Like the filter indicator, the GPA health indices are independent of gas turbine load.
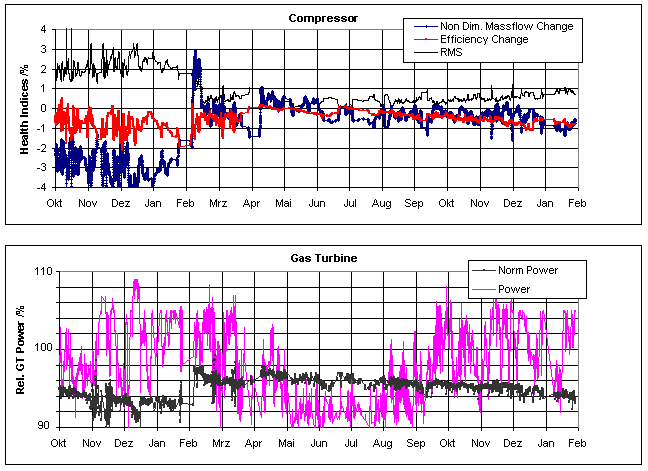
Fig. 10: GPA results before and after an overhaul.
5 Discussion #
Gas path analysis and filter analysis of gas turbine components need an appropriate set of instrumentation. The ideal set of instrumentation depends on the type of gas turbine and the type of physical faults of interest.
Diagnostics of trended data require reliability in terms of data repeatability. However, instruments are susceptible to calibration errors, recovery losses, electromagnetic radiation interference, and drift caused by changes in ambient conditions. It is important at this point to differentiate between repeatability and accuracy. Since gas path analysis is a differential method, changes in the health indices are important, not their absolute values. Inappropriate or badly maintained instrumentation can lead to the detection of spurious faults, leading to unnecessary and costly maintenance actions.
The measurements depend on the accuracy and reliability of the chosen instruments and their position. Whereas accuracy errors are virtually eliminated in the process of measuring the change in performance, reliable measurements are dependent on the random error that derives from repeated measurements (precision error).
Generally, the component characteristics of the gas turbines that are used for the gas path analysis performance modeling are hardly known from power plant design. Component characteristics can vary due to measurement errors, and differences of calculated and/or measured data. Monitoring deviations of measured data and calculated values of component characteristics is an essential element of model reengineering in order to increase the accuracy of health indices. This requires small adaptation to known component characteristics to fit the current measurements.
6 Conclusions #
Over the years high costs of ownership in turbomachinery have resulted in considerable interest in advanced maintenance strategies. One way to tackle this high cost is to employ thermodynamic diagnostics tools such as gas path analysis, filter analysis, and knowledge-based tools for monitoring continuously the state of the engine components.
This enables the operator to proactively plan and manage maintenance activities.
The proposed method is complex and needs to be applied with considerable care. This is especially true for the choice of measurements and the awareness of measurement non-repeatability.
Model-based engine monitoring and diagnostics tools require the specific characteristics of the components to be considered individually. Sensor equipment and data processing have to be studied carefully and systematic errors have to be eliminated. In addition, the steadiness of operation and influence of intake preheaters, evaporation-coolers or online washing have to be considered either in the engine models or by appropriate selection of the evaluated sets of measurement. Such data validation is based on the combination and evaluation of different performance diagnostics over time. The resulting pattern of diagnostics is represented in the monitoring system.
References #
- MSc ETH Daniel Pfammatter, MSc ETH Tiziano Canali, MSc Shima Fahima “Grid stabilization solutions – grow existing grids under increasingly complex conditions” Easy Energy Companies & Consulting SA / IMA Forum, (2019).
- D. Pfammatter, T. Canali, “Gas turbines plants maintenance – A focus on auxiliaries facing cost reduction measures”, Easy Energy Companies & Consulting SA / IMA Forum, (2016).
- P. Escher, “Gas Turbine Data Validation Using Gas Path Analysis”, Proceedings of ASME TURBO EXPO 2002, Amsterdam, GT-2002-30024.
- ISO 10816, ‘Mechanical Vibration – Evaluation of Machine Vibration by Measurements on Non-Rotating Parts”, 1995.
- H. I. H. Saravanamuttoo, “A Preliminary Assessment of Compressor Fouling”, ASME Paper 85-GT-153, [6] Deloitte insights “The Industry 4.0 paradox_ Overcoming disconnects on the path to digital transformation”, [7] Deloitte insights “Tech Trends 2020”.


