

Abdulilah F. Alsaeedi1,2, Yasin Khan3, Ali M. Eltamaly2,4
1 Saudi Electricity Company, Operation and Control Business Unit, Riyadh, Saudi Arabia.
2 Sustainable Energy Technologies Center, King Saud University, Riyadh Saudi Arabia.
3 Electrical Engineering Department, King Saud University, Riyadh, Saudi Arabia.
4 …Electrical Engineering Department, Mansoura University, Mansoura, Egypt.
Abstract #
Most of the generation in Saudi Arabia consists of a centralized generation solely depending on oil and gas, to meet the country’s growing energy requirement. Distributed Generation Resources such as wind and photovoltaic, or any other approach that has been adopted lately. These distributed generation sources are normally placed close to load centers and are added mostly at the distribution level in the grid system. This study focuses on the optimal size and placement of photovoltaic distributed generation units in the real power system in Layla Town, Kingdom of Saudi Arabia. The objective function of this research study is to reduce the generation cost, and real power losses while improving the system voltage profile. In addition, the Voltage Stability Index is also considered with a certain related weighting factor in the objective function. The Particle Swarm Optimization method is used to allocate suitable distributed generation units in the system. The proposed technique is applied firstly to IEEE 33-bus distribution system for verification, then the transmission network of Layla town is used as a case study. Both models were simulated and executed using MATLAB. According to the results obtained, the optimal size and location of the distributed generation units can reduce real power losses ranging from 29% up to 41% depending on the system size, the amount of Variable Renewable Energy penetrated, and structure along with a substantial enhancement in the bus voltages.
Keywords— Distributed Generation Resources, Photovoltaic, Loss Minimization, Particle Swarm Optimization
1 Introduction #
The rapid growth of the electrical energy demand in the Kingdom of Saudi Arabia is one of the greatest challenges. In the past, it has been eliminated by using conventional generation resources such as oil and gas. Nonetheless, Saudi Arabia initiates the national renewable energy program under Vision 2030 to increase the renewable energy share in the present energy mix with the ambitious aim to add 27.3 GW to the national grid by 2023[1]. The minister of energy stated, “The kingdom has taken its first step on the road to diversify its domestic energy mix as part of a long-term, sustainable economic vision and a goal of becoming a leader in renewable energy.” [2] Most of the generation in Saudi Arabia consists of centralized generation power plants that also include distribution and transmission network expansion infrastructure to meet the demand requirement. Distributed Generation (DG) is another approach that has been adopted lately. Distributed generation is a small generation source that is connected closely to the load. DG source could be conventional fuel or renewable-based small generation source. Fuel sources are usually small scaled gas turbines or diesel generators, and renewable sources are commonly solar-based or wind- based [3]. An optimal allocation and size of DG will enhance several aspects of the network, it will minimize power losses, improve the voltage profile, increase system reliability, and reduce pollution, and it could be more economically viable than the centralized generation. However, non-optimal allocation and size could lead to an increment in power losses which might consider a burden to the system. For the optimum size and allocation purpose, complex integrative optimization techniques are required such as Particle Swarm Optimization (PSO) [4]-[6], and Genetic Algorithms (GA). Layla town network will be chosen as a case study to apply PV DG due to the severity and criticality of that spot. This article focuses deeply on finding the optimal size and allocation of PV DG, and three different aspects have been followed through this study:
- Studying network by running power flow analysis using MATLAB to find the power losses and voltage magnitude on each bus.
- Defining the optimization method used in this paper with its parameters, formulating it, and executing it.
- Observing the technical impact of optimally allocating the DG into the proposed case studies.

2 Problem Formulation #
In this paper, the objective function of the model will focus on real power losses minimization, and improving voltage in the network. The real power losses objective function will take total real losses of the system without DG integration as a reference base case with respect to system real losses with DG presence. While the voltage improvement objective will look into two aspects of the system bus voltage profile, and Voltage Stability Index (VSI). The total objective function will be expressed as follows:
![]()
The total system real losses objective will be represented as:
![]()
The bus voltage deviation objective is described below:

The Voltage Stability Index (VSI) is given in equation (4):
![]()
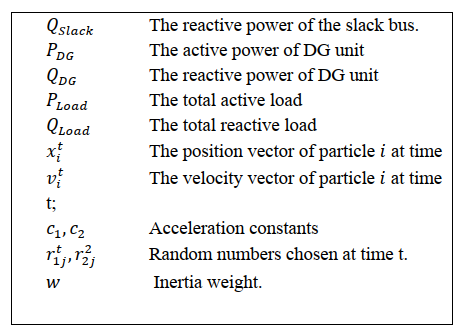
Such that,
![]()
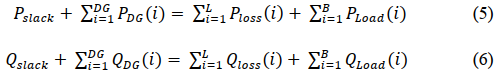
The objective function stated above is respected to the load flow constraints:
Also, the voltage profile at each bus must be in the permissible zone as given in the equation below.
![]()
In addition, the real and reactive power output of the DG units should be within the limits as given below.
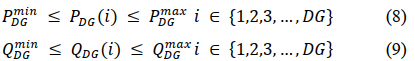
Finally, power flow in the lines must obey the rated thermal limits in equation (10) below at all times.
![]()
3 Particle Swarm Optimization #
Particle Swarm Optimization (PSO) basically, it is an optimization technique used to locate the optimum solution to complex optimization problem. The main inspiration of PSO algorithm is the animal’s movements. Where swarm means population in PSO, and particles indicates members of the population. In PSO algorithm each particle is randomly moving in different directions through the entire space looking for the best solution remembering the personal best solution and the position of its neighbor member. Each particle will update his position and velocity dynamically by communicating with global best particle in the swarm. In the end, all particles will move towards the best position until an optimal solution is reached. PSO algorithm introduced by Kennedy and Eberhart as a non-linear optimization technique inspired by observing the behavior of a flock of birds [8]. The main concept of PSO developed relay on group communication to share individual information such as a flock of birds search for food or migrate to better environment even though the group of birds does not know the optimal position. Eventually, an individual of the group will locate a desirable destination and he will share this information among the group driving them to go towards that position. To understand PSO algorithm model, let’s assume the global optimum of n dimension defined as:
![]()
Where 𝑥n defined as the search variable that represents the set of variables for any given function. The desired purpose here is to find the value of 𝑥 where the function 𝑓(𝑥) could be either a maximum or minimum value. In PSO algorithm, each member represents a possible solution. All members go through search space and adjust their position and velocity depending on its own knowledge and other particles too. Assume 𝑥it indicate particle 𝑖𝑖 position vector search space at a time step 𝑡𝑡, then the updated position of that particle in the search space is given by:

Where ![]() is the particle velocity vector used to update the particle own experience and other particles too in order to drive the optimization process.
is the particle velocity vector used to update the particle own experience and other particles too in order to drive the optimization process.
The main idea of the global best PSO is each particle updates its position depending on the best position of a particle in the entire swarm. Suppose 𝑥i , and 𝑣n indicates the current position and velocity of each particle in the swarm respectively and 𝑃best,i signifies the personal best position of each member in search space. Taking a minimization problem as an example, 𝑃best,i would be the position of particle 𝑖 in search space with the smallest value that predetermined by the objective function. Thus, global best position 𝐺best will be equal the lowest value between all the personal best values. The personal and global best positions will be evaluated and determined in each iteration as follows:
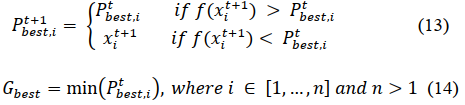
14) Figure 1 below demonstrates the detailed global best PSO algorithm mechanism.
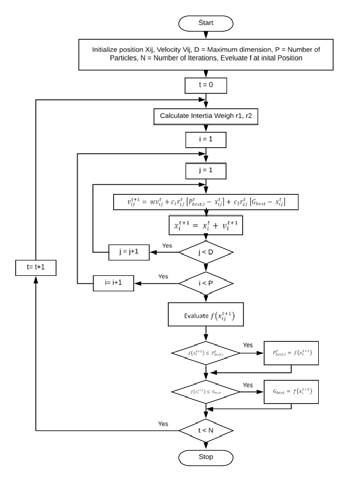
Figure 1PSO Global Best Flowchart.
4 Layla Town Network #
In this paper, several locations have been examined and evaluated to choose the suitable location as a case study to apply Distributed Generation (DG). The criteria for nominating these locations were based on the criticality and sensitivity of the location. Layal town transmission system was nominated as a case study since the load of the town considered critical due to industrial factories located nearby, the transmission system of the town fed from single switching substation (8712 S/S) and small power plant (Layla Power Plant) that will be retired soon, and it is been noted that there are many voltage violations on some buses during peak time [9]. Also, the average daily global horizontal irradiance is 6482 Wh/m2 [10], thus the location has a great potential for installing PV DG. Single line diagram of Layla transmission system shown below. Table 1 and 2 presented the line and bus data of the Layla network.
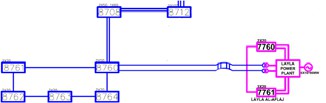
Figure 2 Layla Town Network.
Table 1 Layla Town Bus Data.
|
Branch |
From bus |
To bus |
Line Impedance | |
| R | X | |||
| 1 | 1 | 2 | 5.4853 | 28.036 |
| 2 | 2 | 3 | 18.364 | 93.889 |
| 3 | 3 | 4 | 7.2262 | 30.467 |
| 4 | 4 | 5 | 3.8151 | 16.106 |
| 4 | 5 | 6 | 7.8917 | 33.269 |
| 6 | 6 | 7 | 8.2657 | 34.844 |
| 7 | 7 | 8 | 0.0023 | 0.0323 |
| 8 | 8 | 3 | 4.0175 | 16.952 |
Table 2 Layla Town Bus Data.
| Bus | Load | |
| P (KW) | Q (KVAR) | |
| 1 | 0 | 0 |
| 2 | 18000 | 800 |
| 3 | 60000 | 2200 |
| 4 | 6000 | 400 |
| 5 | 3000 | 120 |
| 6 | 8000 | 750 |
| 7 | 2400 | 150 |
| 8 | 1300 | 60 |
5 Results and Discussion #
A. IEEE 33 Bus Radial Distribution System Results
Firstly, tests have been conducted on IEEE 33-bus radial distribution system to validate the results. the load flow analysis was carried without inserting DG’s in order to calculate the total real power losses of the system and bus voltage profile. Number of DG’s was chosen to be 3 units with a size vary between 0.1 and 2 MW. PSO global best method was designated in this study with the desired parameters listed below after trying several options.
Table 3 PSO Parameters.
| Parameter | Value |
| Swarm Size | 50 |
| Number of Iterations | 50 |
| Acceleration Coefficient 1 | 2 |
| Acceleration Coefficient 2 | 2 |
Regarding the inertia weight, linear decreasing approach mentioned earlier was conducted with an upper value of 0.9 and lower value of 0.4 [11]. Successively, the three DG’s inserted in the most sensitive buses 15 and 13 with an optimal total size of 2.81 MW. As a result, the total real power losses reduced from 0.176 MW to 0.103 MW with a reduction of around 41%. Voltage profile improvements after inserting DG’s with the optimal size and location obtained are demonstrated in the figure below.
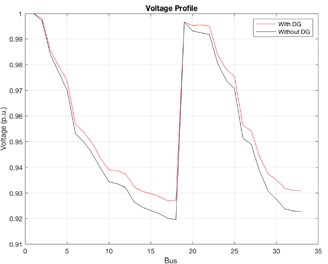
Figure 3 IEEE 33 Bus Voltage Profile with and Without DG.
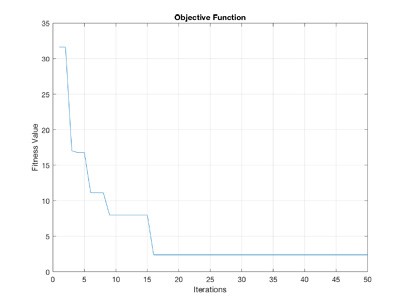
Figure 4 shows the fitness function value with respect to the number of iterations and it’s a quite obvious that the final solution reached after the sixteenth iteration.
- Layla Town System Results
Figure 4 IEEE 33 Bus Model Fitness Value.
In the second model same parameters and configuration used in the IEEE-33 Bus radial distribution system applied here, except it was assumed a 5% growth in the load due to future residential expansion. The results show the three DG’s will be placed on busses 3, and 1 respectively with an aggregated size equal 3.22 MW. The total real power losses initially were 0.206 MW and decreased to 0.146 MW after DG integration with an approximate reduction of 29%. Moreover, the bus voltage profile of the network summarized in figure 5.
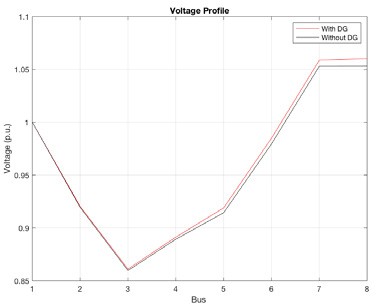
Figure 5 Layal Town Bus Voltage Profile with and Without DG
It is worth mentioning the bus voltage profile improved but turn slightly above 1 p.u. value on some buses. However, the execution time was slower than the previous test system, and the final solution obtained in the thirty seventh iteration as demonstrated in the figure below.

Figure 6 Layla Town Model Fitness Function.
6 Conclusion #
In this article, IEEE-33 bus radial distribution system and Layla town transmission system was selected for placing PV DG with optimal size and location. The PSO global best optimization algorithm used in this case with an objective function focuses on real power losses reduction and improve bus voltage profile. From the results obtained in this paper it can clearly notice the optimal allocation of multiple PV DG’s would reduce the real power losses up to 41% in IEEE 33 bus system and 29% in the Layla network. Furthermore, bus voltage profile generally improved with the optimal PV DG integration. However, placing PV DG’s in Layla case study revealed the bus voltage profile might increase above 1 p.u. value. Finally, PSO global best optimization method approved its superiority in this study, and the final solution reached within short period of time, and PV DG might be considered as an optimal solution in the future.
References #
- www.powersaudiarabia.com.sa
- Saudi Arabia Awards First NREP Solar Projec. (2018, February 06). Retrieved from https://www.powersaudiarabia.com.sa/web/attach/news/300MW- Sakaka-Solar-PV-Project-Awarded.pdf.
- Albadi, Mohammed & Soliman, Hisham & Thani, Mahmood & Al-Alawi, A. & Al-Ismaili, S. & Al-Nabhani, Ahmed & Baalawi, Haitham. (2017). Optimal Allocation of PV Systems to Minimize Losses in Distribution Networks Using GA and PSO: Masirah Island Case Study. Journal of Electrical Systems. 13. 678-688.
- Eltamaly, Ali M., and M. S. Al-Saud. “Nested multi-objective PSO for optimal allocation and sizing of renewable energy distributed generation.” Journal of Renewable and Sustainable Energy 10, no. 3 (2018): 035302.
- Khaled, Usama, Ali M. Eltamaly, and Abderrahmane Beroual. “Optimal power flow using particle swarm optimization of renewable hybrid distributed generation.” Energies 10, no. 7 (2017): 1013.
- Farh, H. MH, A. M. Al-Shaalan, Ali M. Eltamaly, and A. Al-Shamma’A. “A Novel Crow Search Algorithm Auto-Drive PSO for Optimal Allocation and Sizing of Renewable Distributed Generation.” IEEE Access 8 (2020): 27807-27820.
- Danish, Mir Sayed Shah & Senjyu, Tomonobu & Danish, Sayed Mir Shah & Sabory, Najib Rahman & Krishnan, Narayanan & Mandal, Paras. (2019). A Recap of Voltage Stability Indices in the Past Three Decades. Energies. 12. 1544. 10.3390/en12081544.
- Talukder (2011). Mathematical Modelling and Applications of Particle Swarm Optimization by Satyobroto.
- Saudi Electricity Company, National Control Center Department, 2019.
- Erica Zell, Sami Gasim, Stephen Wilcox, Suzan Katamoura, Thomas Stoffel, Husain Shibli, Jill Engel-Cox, Madi Al Subie, Assessment of solar radiation resources in Saudi Arabia, Solar Energy, Volume 119, 2015, Pages 422-438, ISSN 0038-092X,
- Xueyan, Lin & Zheng, Xu. (2015). Swarm size and inertia weight selection of Particle Swarm Optimizer in system identification. 1554-1556. 10.1109/ICCSNT.2015.7491026


