


Author: Tomas Hladik
Organization: Logio
Country: Czech Republic
Abstract #
Today, Digitization, Industry 4.0 and Maintenance 4.0 bring about vast volumes of data. Technologies like IoT or IIoT allow large sets of devices to connect to data networks and send complex data continuously. Organizations now keep huge amounts of data, structured or unstructured. However, from research of renowned organizations like Gartner we know, that industrial firms today are not able to use 70-90% of data that are collected and stored. This paradox is described in the paper, and various generic models of big data monetization are proposed. Some of these models are shown on examples from spare parts management.
Spare parts inventory can lock in significant amounts of working capital. This paper summarizes recommendations for effective spare parts inventory management and spare parts optimization using various sets of data and statistical analytical methods.
Keywords: Digitization, IoT, IIoT, Monetizing, Spare Parts Management
Introduction #
Management of spare parts and other materials needed for realization of maintenance processes is one of the key functions in physical asset management. Especially in power generation, oil and gas and heavy chemical industries, spare parts inventories can easily add up to tens of thousands of various items, in a value of hundreds of millions of euros. It is obvious that efficient spare parts inventory management can have significant impact on the financial performance of the company. Better spare parts management can lead to improvement of financial performance of the company. In previous research we discussed several recommendations for spare parts inventory management. Using these recommendations, companies can achieve better financial performance in different parts of the spare parts lifecycle. In some of these recommended practices, various data can be employed and analyzed – especially in areas like portfolio segmentation, criticality assessment, forecasting, improving spare parts naming and identification, or cleaning and rectifying master data.
Eight rules of good spare parts management #
In our previous research, we refined the following eight rules – best practices – for good spare parts management:
Focus on preventive maintenance – for preventive maintenance no inventories of spare parts need to be held.
Solve problems in spare parts processes. Segment your spare parts portfolio.
Evaluate spare parts criticality.
Use suitable forecasting methods and verify their accuracy and reliability. Use special methods for intermittent demand items.
Consider the whole lifecycle of your assets while making decisions related to spare parts.
Implement a good information system for spare parts management so all above stated rules are supported and/or automated.
Some of these rules are described in detail in the following chapters.
Each item is different: Segment your spare parts portfolio #
In almost any inventory, different groups or segments of items can be identified. The primary objective of segmentation is to effectively divide an extensive portfolio of items on stock into separate groups requiring a different inventory management system, approach in planning, or specific optimization methodology. A good spare parts management information system allows for carrying out such analyses and portfolio segmentation quickly and easily, including visualization of outputs.
For inventory segmentation, a number of methods and criteria can be applied:
ABC analysis of inventory based on quantity and value available on stock (Fig. 1) and other criteria
ABC analysis according to item consumption (Fig. 2)
Segmentation based on frequency of consumption (identification of slow-moving inventory) in quantity or value (Fig. 3)
ABC analysis according to item criticality
Categorization based on item accessibility (common, special, made-to-order) Identification of intermittent items (special test of intermittent demand)
Segmentation based on suppliers’ leadtimes
For ABC analyses in case of spare parts, the prevalence of categories C and D (items with low or zero consumption in long-term history) is very typical.
Using segmentation based on consumption frequency, slow-moving inventory (SMI, items with minimum turnover, including “dead stock”) items can be promptly identified (Fig. 3). For spare parts, the 0 segment is usually the most important. This segment covers items with no consumption record in the past 12 months. Segment 0 is generally the most significant both in quantity and in value. It includes items of strategically important and critical spare parts – items with the highest value in the portfolio. Other segments with low frequency of demand are also significant (segments 1, 2, etc.). Segments with frequent consumption (segments 10, 11, 12) contain items of fasteners with relatively low value (Fig. 3).
The segmentation may also include specification of links between spare parts and appropriate production equipment (technical site). Bills of material, obtained in this way, make it possible to closely trace spare parts consumption for individual parts of production equipment, measure costs in each stage of the production equipment life-cycle, and identify critical spare parts in relation to the criticality of production equipment.
For each identified inventory segment (or for each individual item, if possible), the required level of availability (service level) needs to be specified. The desired logistic service level is closely related to the spare part’s criticality: for highly critical items a service level of, for instance, 99.7% will be required. Obviously, there is a trade- off involved: the higher service level that is required, the higher minimum level of inventory is needed.
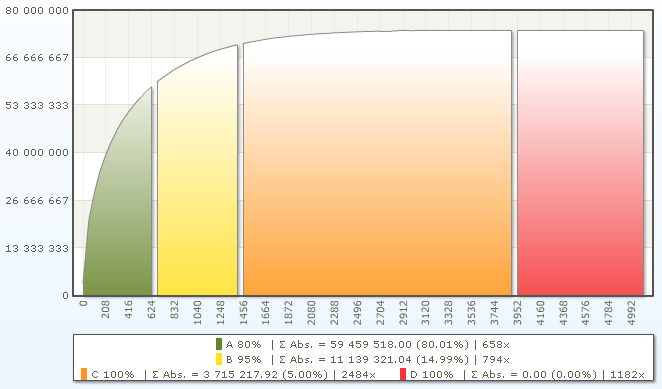
Figure 1: ABC analysis of spare parts inventory based on available stock value [CZK].
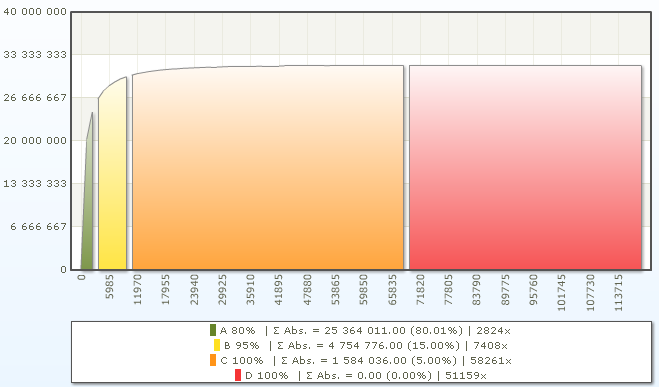
Figure 2: ABC analysis of spare parts inventory based on consumed quantity [pcs]. Dominance of categories C and D (i.e. items with very low or zero consumption) is characteristic for spare parts.
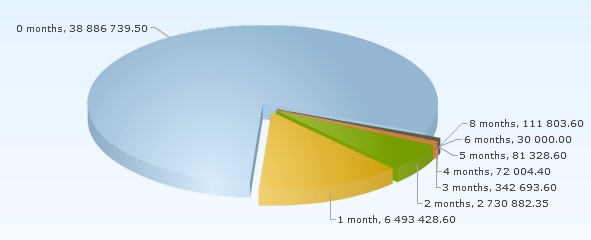
Figure 3: Spare parts inventory segmentation in value according to the consumption frequency in the last 12 months. Segment 0 represents the value of items with no consumption over the last 12 months; segment 1 represents the value of items with consumption recorded in 1 out of 12 months of the analyzed year, etc.
Analyze spare parts criticality
In large organizations operating large production systems, the size of spares portfolio amounts to tens or hundreds of thousands of items. It is therefore essential to be able to distinguish the important ones from the others. Criticality of spare parts is after all the ultimate measure of spare parts’ importance.
The level of a spare part’s criticality is inevitably related to the criticality of the production equipment it is used for (so having an RCM analysis done will certainly help in assessing the criticality of spares). However, we need to keep in mind that criticality of spare parts is not equal to criticality of the device the spares are used for.
When analyzing criticality, we need to collect and look at various areas of data linked with the item: cost of inventory holding, failure probability, impacts of spare part unavailability, leadtime and other parameters – as shown in Fig. 4. Based on the level of item’s criticality, appropriate service level targets should be set.
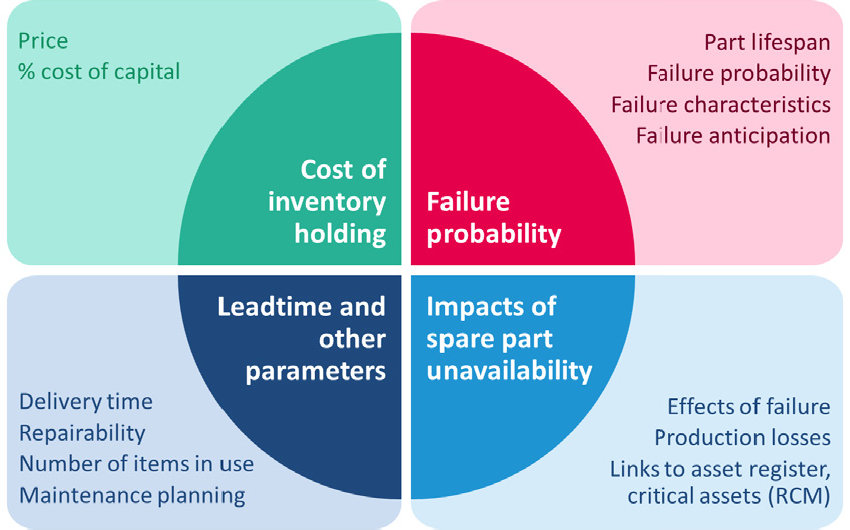
Figure 4: Spare parts criticality analysis areas
In practice, costs of inventory holding and costs of spare parts unavailability should be carefully balanced. Costs can be compared using the following equation:
(1)
Where Cinv are costs of inventory holding per one year and Cun are costs of unavailability of spare part in case of need calculated per one day. LT is lead time calculated in days and f is frequency or probability of failure (need for spare part) as occurences per year.

Figure 5: Equation of criticality calculation – example
If all data for the equation is available, criticallity can be calculated directly – and easily. But in practice typically some the variables in the equation are not known at all or are uncertain, blurred and inaccurate. This is where advanced analysis of avialable data comes to question. From our experience, in industrial organizations a number of interesting sets of data can be utilized to evaluate (or support evaluaton) of spare parts’ importance (criticalness or criticality).
In the following diagram (Figure 6), a 2-level evaluation of criticality (or identification of critical items – materials or spare parts) is described. This 2-level approach allows for “clever”, efficient process of evaluation of large numbers of items. Using various data sources like spare parts master data, history of spare parts transactions, RCM data, data from previous assessments of critical items, bills of materials etc., a preliminary separation of clearly non-critical items vs. suspicious (potentially critical) items can be done by means of data analysis without human interaction. After this preliminary evaluation, we can spot the relatively small group of potentially critical items and focus further evaluation on them. In this way the preliminary evaluation can safe a lot of work and time otherwise required from maintenance technicians to assess each item individually.
In the second step, potentially critical items are scrutinized thoroughly to find out their level (score) of criticalness. This can be done either in quantitative way (if required data is available) or qualitative way (data must be collected by means of questionnaires filled-in by maintenance technicians or engineers).
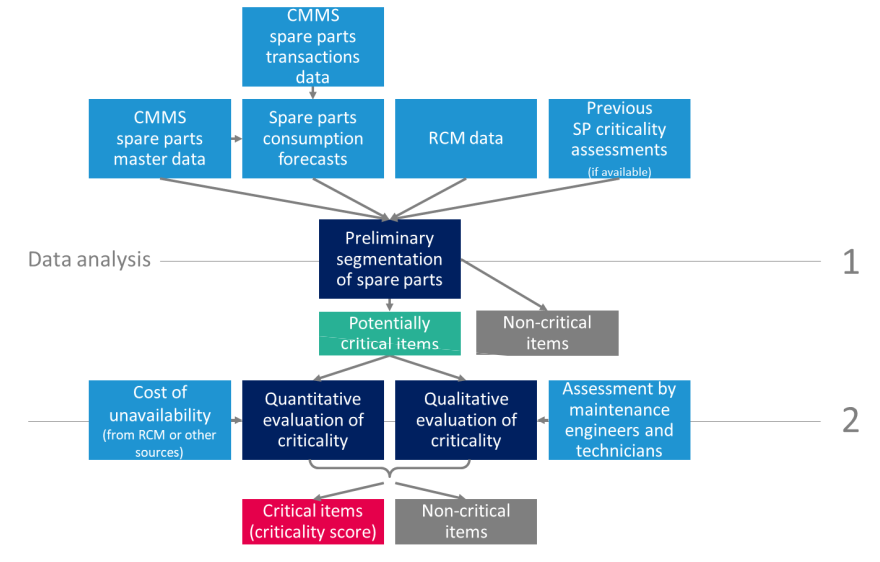
Figure 6: 2-level evaluation of spare parts criticality.
If data for quantitative calculation is not available, we need to rely on information from maintenance engineers or technicians. To objectivize their subjective view on spare parts (maintenance engineers are often strongly biased towards keeping excessive inventory, ”just to be safe”), we have proposed a structured questionnaire. Questions about spare parts relailability, probability of failure, and impact of unavailability, lead time, etc. should be designed to fit specific conditions of the organization (industry, technology/production equipment used etc.). The equation
(1) should be taken into logarithm, so we can change variables for indices which can be added and subtracted instead of multiplicated. Answers should be given weights, and the questionnaire should be balanced so that we can have sums for each area (index) as shown in the following equation:
I_P-I_un-I_LT-I_f=0 (2)
This allows for summing weights for answers in each area into a single index. If the left side of equation is greater than 0, we should keep at least one item of spare part in stock. If it is less than 0 we should not – this spare part is not critical.
Weights should be tested on selected parts with known (or agreed) criticallity. A pilot mix of spare parts should include some parts which are critical for sure, some which are not, and some which are in between.
It is essential to include maintenance engineers in both selecting questions for the questionnaire and in selecting weights for answers. This helps to create a better understanding of the questions and the whole purpose of the criticality assesment. A maintenance engineer should be able to fill the questionnaire in an average time of 2-10 minutes, so that the criticallity assesment will not consume much of working time.
Although assessment can be done on paper or in Excel, today it makes great sense to use available services like Google Forms or SurveyMonkey or others, that can be used to collect needed data and minimize the work with collecting, processing and analyzing the data.
Spare parts management starts with good forecasting #
The next step in the specification of optimum spare parts inventory management regime is the prediction of future demand (consumption) for the items in stock. The forecast is always based on transactional data from information systems – history of spare parts consumptions, which must be representative (meaning sufficiently long). In the case of spare parts, we usually work with a history of three to ten years (depending on industry). Three years of recorded history seems to be the minimum for intermittent items. A general rule here applies: the longer the history, the better and more reliable the forecast.
When analyzing historical consumption, we need to carefully distinguish between material consumed for planned maintenance (planned shutdowns, turnarounds, preventive maintenance) and spare parts issued for unplanned (corrective) maintenance – repairs. In forecasting, we must adjust the history for planned maintenance.
In the forecasting process, items should be treated individually, according to the character of their consumption. Items with common demand patterns (high runners – fast moving items like fasteners, etc.) can be forecast using a number of standard statistical methods normally used in inventory management (moving average, exponential smoothing, Holt’s exponential smoothing, trends, seasonal indexes, Winter’s method, etc.). Items with intermittent demand require a special suitable method to be applied. The use of standard methods of prediction and inventory management in case of intermittent items results often in a substantial overestimate of future consumption and therefore excessive inventory level.
Intermittent demand is the pitfall of spare parts management
One of the specific problems in spare parts inventory management is the nature of spare parts consumption – intermittent demand. If we analyze the consumption history of a typical spare part, we find that the historical consumption in most of the analyzed periods amounted to zero. Such infrequent or intermittent demand, usually with demanded quantity of just a few pieces, is very typical for spare parts and other maintenance inventories. An example of the consumption history of an intermittent demand item is presented in Fig. 9.
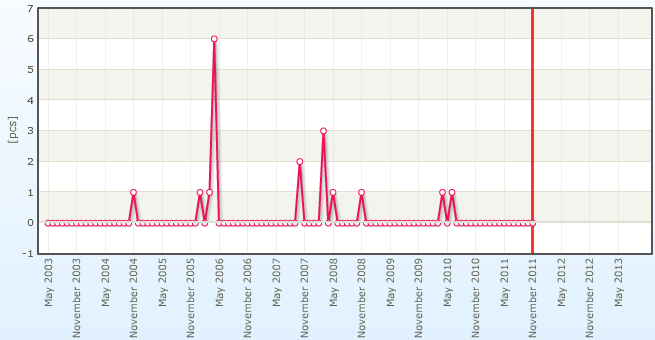
Figure 7: Intermittent demand in maintenance (item: Spiral sealing DN25-40 RF)
In maintenance, intermittent demand is quite often combined with long supplier leadtimes. For maintenance inventory management, intermittent demand and long leadtimes are a tricky complication, often leading to large overstock. The main problem with managing and forecasting intermittent items is that the standard forecasting methods used for fast moving goods (for instance moving averages, exponential smoothing, Holt’s and Winter’s method, constant or regression models with seasonal indexes, etc.) simply do not seem to work for these items. In case of intermittent consumption, special statistical methods (such as bootstrapping or Smart-Willemain method) need to be applied.
Smart and Willemain (2004) suggested a stochastic simulation forecasting method. Using this method it is possible to specify minimum inventory level (re-order level) in order to ensure fulfilment of requirements with target probability (logistic service level, target of availability). The method is based on random sampling from the history of consumption. In statistics, similar methods are called bootstrapping.
Besides intermittent items, in a large maintenance inventory we can also find fast- moving items with stable and high regular consumption. These are especially items of common consumables like fasteners, generic gaskets, or bearings. For these items, standard methods of inventory management and future demand forecasting can be applied.
Identification of spare parts and cleaning master data
In spare parts optimization projects we quite often face various problems with quality of spare parts master data – especially naming: issues with unstandardized naming or incorrect names, names in various languages, different word order, typos etc. hinder significantly all efforts in spare parts optimization and generally result in duplicate (or multiplicate) master data records for identical materials (identical spare part is stored in several master data records with different names). In order to clean spare parts master data we apply advanced data analytics on master data to identify or cluster duplicate (or similar) items. This key analytical method
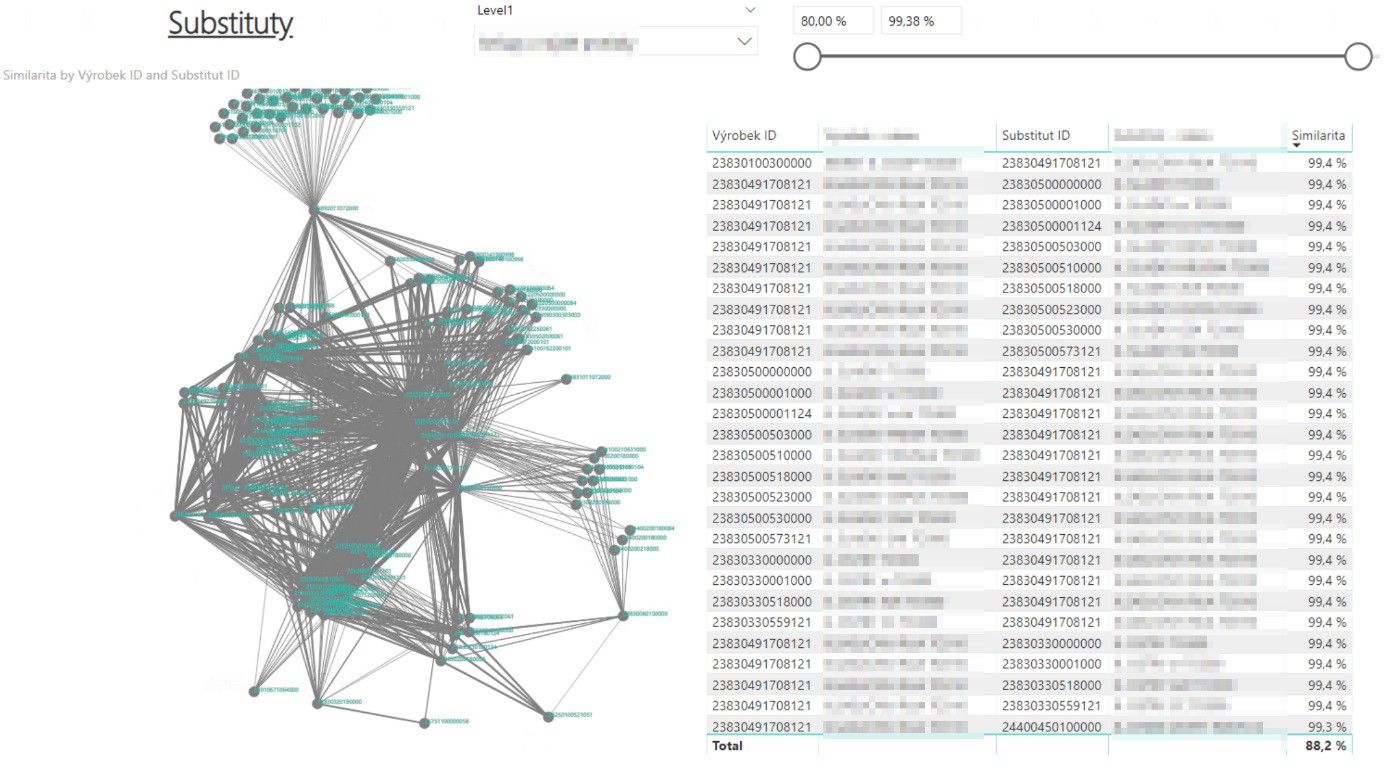
Figure 8: Clusters of similar items found in master data.
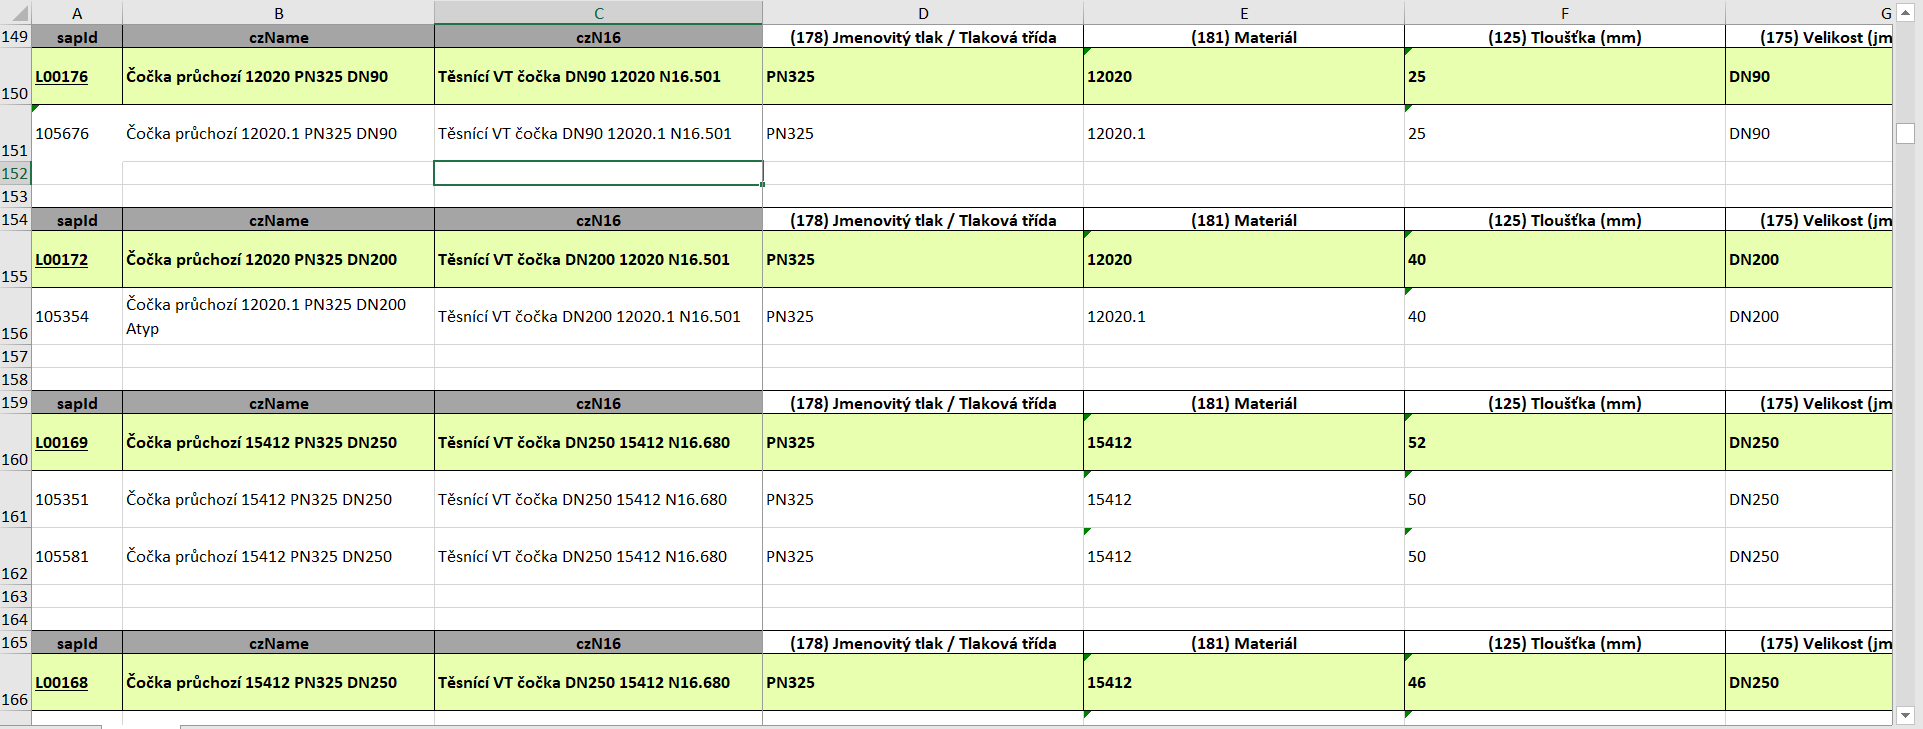
Figure 9: Validation table with potentially duplicate items found in master data.
Conclusions #
It can be concluded that spare parts management as a part of physical asset management has significant impact on financial statement of the company. Good spare parts management brings the following benefits:
Optimum spare parts quantities are purchased Optimal purchasing cashflow
Lower inventories
Less unused inventories
Higher availability of needed spare parts Good risk management
Various sets of data can be used to support or optimize spare parts management, especially in spare parts segmentation, criticality assessment, forecasting, master data rectification. The examples demonstrated in the paper indicate ways to utilize vast amounts of data available in organizations today – to actually monetize the data by improving efficiency and effectiveness of spare parts management processes.
References #
IAS 2 (2009) International Accounting Standard 16 – Inventories, IASCF 2009
IAS 16 (2009) International Accounting Standard 16 – Property, Plant and Equipment, IASCF 2009
IAS 16 (2009) Property, Plant and Equipment – Clarification on classification of servicing equipment as inventory or PP&E, IASCF 2009
Hladík Tomáš, Tulach Petr: Are your spare parts really critical? Euromaintenance 2014, Helsinki Finland, 2014
Nielsen Helms Erik: Impact on financial performance by physical asset management. The Asset Management Conference 2015, London, UK, 2015
Tomáš Hladík, Petr Tulach, Eva Heringová: Financial impacts of spare parts inventory management – Finance driven spare parts inventory management. Euromaintenance 2016, Athens, Greece, 2016
Willemain, T.R, Smart, C.N. and Schwarz, H.F.: A new approach to forecasting intermittent demand for service parts inventories. International Journal of Forecasting, 20, 375-387, ISSN: 0169-2070, 2004


