

Musleh Alameri, Wael Emara,
National Grid– Saudi Arabia
Abstract— This paper analyzes the three-case studies for aging electrical assets which have highly impacted the technical key performance indicators (KPIs) in Jubail city, Saudi Arabia. It has been discussed the optimal way for the operating expenses on that asset and shown how to be reflected in its reliability as a KPIs. The paper applied to 115 kV overhead transmission line and 13.8 kV switchgear on the National Grid SA Company. This research highlighted the benchmarks to expand the asset life cycle with minimization of the expenses or to take a decision to replace it using Markov based model.
Index Terms—Asset management (AM), Reliability, Key performance indicator (KPI), maintenance, Asset life cycle.
1 INTRODUCTION #
asset management, extending the asset life cycle, optimizing operation operational expenditure (OPEX), and improving key performance indicators (KPIs) are substantial topics in the electrical network. The governments and national electricity companies are investing billions of dollars to build reliable electrical grids. These assets have a specified life cycle such as 30,40 or 50 years, then, after that age, the assets must be replaced or bear the consequences of its poor dependability. However, there is a third option to expand the asset life using the asset management (AM) approach. AM is operating the asset on the optimal way to assuring a proper return [1].
The Asset Management (AM) on National Grid SA (NGSA) aimed to find the optimal balance between Risks, Costs, and Performance. The Asset Risk management contains several aspects to evaluate it as the compliance, the safety of assets and human, energy lost reliability, reputation, financial cost, and likelihood.
In this paper, a system consisting of an ageing 115 kV overhead transmission line and 13.8 kV switchgear. It will study the impact of (AM) on their (KPIs) included Energy Not supplied (ENS), the System average interruption duration index (SAIDI), the system average duration frequency index (SAIFI), the momentary average interruption frequency index (MAIFI), and the forced outage frequency index (FOFI). Additionally, the research assesses the (OPEX) and how to be affected by the interpretation indicators and the forced outages cost.
The OPEX on this research be made up of materials, equipment, tools, manpower costs, and the forced outages cost (FOC), the FOC comprise the same factors with opportunity costs from ENS loses which is that supposed money to gain it from the consumer in case no interruption.
2 OBJECTIVE #
Asset Management (AM) aims to increase asset return while maintaining a certain level of reliability. The AM difficulty and challenges increased with the ageing of equipment. The objectives of the paper are:
- Determine and analyze the OPEX for a specific asset that considering in the paper case studies.
- Define and evaluate the technical KPIs for those assets.
- Investigate the relationship between the expenses and their impact on the KPI.
- Apply Markov based model on the case studies.
The Asset Management of ageing equipment provides an optimal way for the expenses and ensures the financial and technical return on the investment is taken.
3 PROBLEM FORMULATION #
The purpose of this paper is to achieve the maximum return of operational expenditure. The return knows to be a financial, technical improvement, or minimize the asset risk.
A. Main Objective Function:
The main objective function of Asset Management is a combination of three main topics, which are OPEX, KPI, and Asset risk, it can be expressed as:
![]()
Were,
R Return on the investment.
OPEX Operational expenditure
KPIs Key Performance Indicators.
B. Operational Expenditure:
The Operational Expenditure can be formulated in this research paper as:
![]()
Were,
MB Manpower cost
MT Materials cost
FOC Forced outages cost
C. Forced Outages Cost:
On the other hand, the forced outage costs which mainly on the interpretation time can be devised as:
![]()
Were,
![]()
Opc and ENG are Opportunity cost Energy not supplied, respectively.
D. Asset Risk Register:
![]()
Were,
![]()
ARR Asset Risk Register
C Compliance
S Safety of assets and human
ELR Energy lost reliability
R Reputation
FC Financial costs
E. Reliability Indices:
To study the power quality and reliability of the system we need to calculate different indices [2,3].

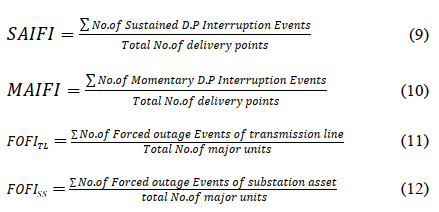
Were,
ENG Energy not supplied
SAIDI System average interruption duration index
SAIFI System average frequency duration index
MAIFI Momentary average interruption frequency index
FOFItl Forced outage frequency index for transmission Line.
FOFIss Forced outage frequency index for substation
4 METHODOLOGY #
A. Markov based model:
The Markov based model classifies the asset condition into four stages, the time of need for refurbishing/replacement is defined as shown in Fig.1. However, it depends on many criteria to confirm which routing services are, and what is the action needs.

Fig.1 State-based ageing model [4,5]
B. Run, Repair, Refurbish, and Replace Decisions:
The Asset Management has the popular strategic which called run, repair, refurbish and replace [6], the question is for the companies how could minimize the repair and refurbish as well as extend the asset life cycle, on the other hand when the organization takes the decision stope the expenses on the asset by taking actions such as replace or disposal the asset. It is difficult to find an answer that can be applied to every company, although, this paper will touch some practices that can be applied to minimize the OPEX and facilitate decision making.
- Maintenance Strategies:
The main factor is to increase asset life cycle is the efficient maintenance. it is classified base on two aspect conditions of asset and maintenance importance as shown in Fig 2. The most popular type is Time Based Maintenance (TBM), despite TBM is widespread. The Reliability Centered Maintenance (RCM) for the ageing assets is used for many organizations even it is not documented on its procedures. Illustrated to increasing maintenance frequency for the asset has poor performance. RCM NGSA has been changing its maintenance strategy to be RCM to develop the assets dependability and optimize the resources and minimize the OPEX.
Additionally, the condition base maintenance and corrective maintenance for HV [7] and distributions grid respectively, used in some companies as a maintenance strategy. Although it is used to reduce costs, the consequences for these applied are more than what achieving from the cost reductions.

Fig.2 Classification of maintenance strategies [8,9]
2. Risk Management:
Asset Risk Management is one of the three pillars of asset management [10]. It is providing a clear view for the company, have it to continue spending on the repair/ refurbish or must decide, and which kind of decision is required, the risk management plays an important role in this aspect. The NGSA adopted the Consequences and probability module as Fig.3. The consequences of its, including the compliance, the safety of assets and human, energy lost reliability, reputation, and financial costs [11]. The outcome from this module after taking the happened risk probability and its consequences shall classify all assets in different categories as shown in fig.1. Based on that the proposed solution submitted and reassessment to investigate the solution validations.

5 RESULTS AND ANALYSIS #
A. Input data:
It has applied three case studies, two of them on high voltage overhead transmission lines, and one case specified on the medium voltage switchgear as shown in Table.1
Table.1 Case Studies Input data
| No. | Name | Voltage level | Energized date | Original Life cycle |
| Case 1 | Line A | 115kV | 01/04/1972 | 30 years |
| Case 2 | Line B | 115kV | 01/06/1975 | 30 years |
| Case 3 | SWG 1 | 13.8kV | 04/01/1983 | 30 years |
B. OPEX on the case studies assets:
The results show expenses on the case studies assets of Line A, Line B and SWG 1 have fluctuated which means time base maintenance is not used mainly. The equipment condition is one of the main factors as displays in the charts the relation between OPEX and KPIs.
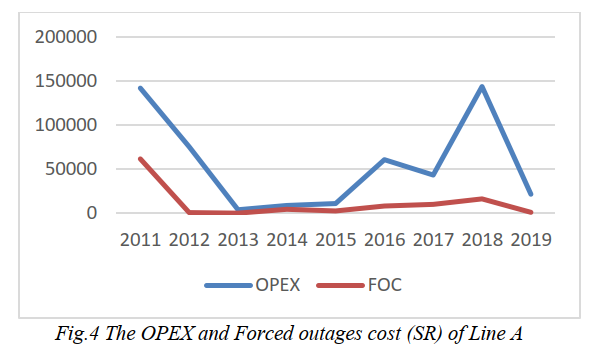
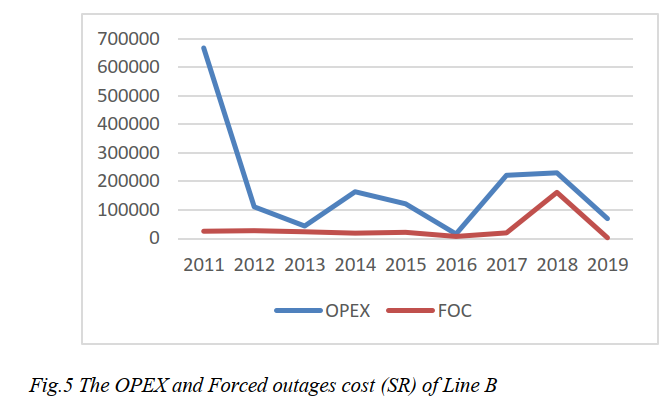
The transmission lines have almost the same behaviors as graph form. It is noted OPEX increased/decreased parallels with forced outages cost in several years such as 2011 in Line A and 2018 in Line B. However, the scale measure is different in Fig.4 and Fig.5 due to the high amount of expenses in Line B, especially refurbish what was happed in 2011.
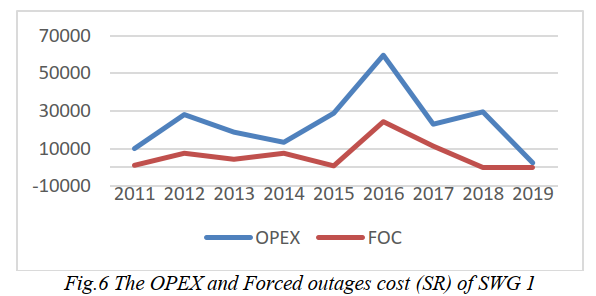
The SWG 1 has been the liner relation between high expenses forced outages cost as shown in Fig.6, that due to the asset was on the stage called on Markov based model “poor”. Referring to Fig.1 it has two options, whether to continue spending on refurbishing or replace. Therefore, the decision-maker chooses the replace option in 2016 after OPEX increased continuously.
C. KPIs for the case studies assets:
In this part, it will show the technical KPIs for every case study from 2011-2019, which included on the chart for SAID and another chart for the remaining KPIs such as SAIFI, MAIFI, FOFI, and No. of interruptions.
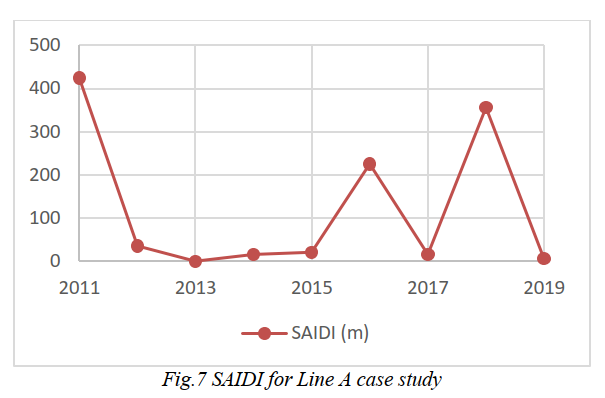

The Line A case study shows how the improvement on the KPI that related to the duration as SAIDI concurrently with the measure investing to repair the asset in 2011 as shown in Fig.7 and Fig.4. However, it is shows enhancements it’s on four years from 2012-2015, this perfection was not sustainable for the years 2016-2019.
On the other hand, it is clear from the Fig.8 the expenses have reinforcement the asset has a temporary improvement on interruption frequency KPIs as noted on 2013, although, the investment on the line on 2018, Its positive results began to appear for all KPIs, It could be the root cause of the failures has been repaired or replace it.
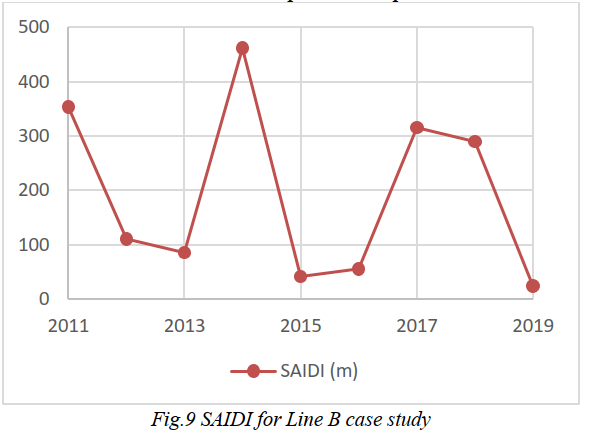
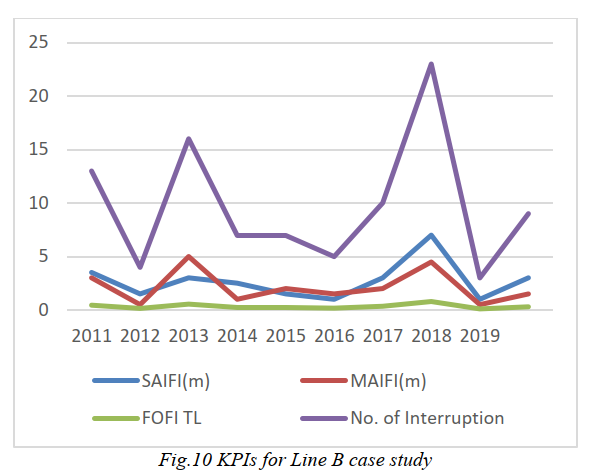
The second case study for Line B has massive expenses in 2011, although of that, its KPI has not improved as expected as shown in Fig9 and 10, compared with its expenses (Fig.5) and Line A KPIs. The charts show fluctuated behavior; therefore, it is not healthy to confirm the improvement in some years which could temporary enhancement.
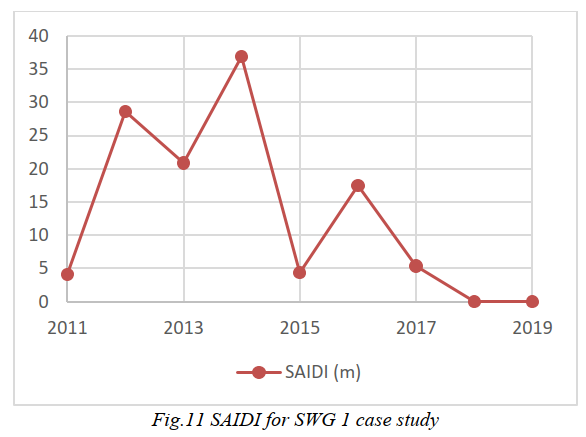
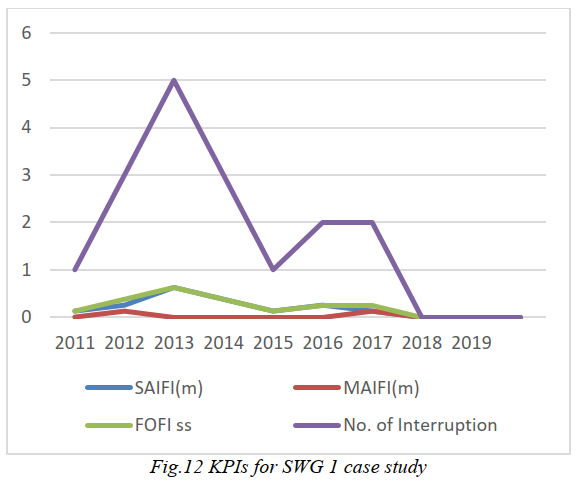
In the final case study in this paper, it was on switchgear 13.8 kV, this is the ideal application of effective maintenance with getting excellent outcomes from expenses from what was invested in. It is clear from Fig.11 and Fig.12 compared with Fig.6.
D.Asset Risk Management:
Asset risk management (ARM) of the three cases has been applied to varying degrees. Table 2 shows the asset risk register included two aspects which are consequences and probabilities. It evaluates the consequences out 25 included compliances, the safety of assets and humans, energy lost reliability, reputation, and financial cost. The formulation no (6) has been used. The probabilities evaluation was out of 5.
Table2. Asset Risk Register
| Case1 | Case2 | Case3 | ||||
| Year | Conseq. | Prob. | Conseq. | Prob. | Conseq. | Prob. |
| 2011 | 22 | 4 | 24 | 4 | 16 | 2 |
| 2012 | 20 | 4 | 23 | 4 | 19 | 4 |
| 2013 | 18 | 3 | 22 | 3 | 19 | 3 |
| 2014 | 18 | 3 | 22 | 4 | 19 | 3 |
| 2015 | 19 | 3 | 18 | 3 | 20 | 4 |
| 2016 | 20 | 3 | 19 | 3 | 20 | 3 |
| 2017 | 22 | 4 | 20 | 3 | 17 | 3 |
| 2018 | 22 | 3 | 20 | 4 | 17 | 2 |
| 2019 | 17 | 2 | 19 | 4 | 15 | 2 |
It is clear from table 2, the asset response to the repaired/ refurbish has reflected on the asset risk register rates. However, the ARM is the main input factor of asset management that can be decided, manage, and monitor the asset on the optimal way until the disposal decision is made.
6 CONCLUSION AND RECOMMENDATION #
The objective of this paper is to investigate the asset management applications in three case studies using Markov based model. The results of that were different outcomes of these cases have been noted and analyzed.
It demonstrates the return on expenditures depends on asset condition and the kind of action taken to reinforce the equipment. It has been proven in the line A case, it has a good return on the duration of the interpretation KPI, with a modest impact on frequencies interpretation after 2011 repairing. However, the 2018 reinforcement has a massive improvement on all KPIs. The efficacious rehabilitation has been shoes on SWG 1 case.
However, continence maintenance and repairing not always the ideal solution as substantiated online B. The asset management could choose the optimal solution which even the disposal of the assets could be the optimal option in some cases. Alternative options such as change the network configurations or replace the assets sometimes are feasible and useful instead of continuing to growl OPEX of the organization.
To sum up, it is recommended to make disposal/repaired decisions based on optimization between expenditures and KPIs affect feeding on historical data. Asset risk management shall be a consideration as one of the main factors to determine to continue expenses on ageing assets or disposal.
The reliably centered maintenance is the suitable type for the ageing asset due to kept and monitor the asset-based its outcomes. However, the assets KPIs is advisable to include it as the main factors for RCM and the kind of repairing/action taken required.
For further studies, the feasibility study of the ageing case studies asset using CAPEX, OPEX, and other factors to formulate the optimal time to dispose of/replace the assets.
REFERENCES #
- Schneider, J., Gaul, A., Neumann, C., Hogräfer, J., Wellßow, W., Schwan, M. and Schnettler, A., “Asset management techniques” International Journal of Electrical Power & Energy Systems, 28(9), pp.643-654, 2006
- CIGRE Technical Brochure 367 “Asset Management Performance Benchmarking”, Working group C1.11,2008.
- Electricity & Cogeneration Regulatory Authority. “ECRA Régulations Codes”, Ecra.gov.sa ,2020
- Kurtz, C. et al “Managing Aged Transformers” Transmission and Distribution World, July 1, 2005
- Gaul, A. J. Nilges, J., Nockmann, E., Thurlby, R.”Strategic Investment Planning”. CIRED 2005, Turin 6-9 June 2005, session 6
- Gilpin, A. and P, –., 2020. “Strategic Asset Management for physical infrastructure: Run, Repair, Refurbish, Replace” Master. The University of Sierra Leone., 2019
- Study Committee 37 “Ageing of the System. Impact on Planning” CIGRE Technical Brochure 176, 2000
- CIGRE Technical Brochure 309 “Asset management of transmission systems and associated CIGRE activities” Working Group C1.1, 2006
- Singh C, Schwan M, Wellssow WH. “Reliability in liberalized electric power markets- from analysis to risk management -survey paper”. 14th Power system computation conference PSCC, 2002, Sevilla.
- Schneeweis, Thomas, Schneeweis, Thomas, Crowder, Garry B, & Kazemi, Hossein. “The new science of asset allocation” 1st ed., Wiley Finance. New York, 2010.
- Schoeman, J.S, & Vlok, P.J. “The possible influence of risk management, forecasting, and personnel training in physical asset management”, South African Journal of Industrial Engineering, 25(2), 96-104, 2014.


