


Mahmoud Hamdy Safaan1, Mohamed Marzouk2,3
1 Structural Engineering Department, Faculty of Engineering, Cairo University, Giza, Egypt
Email: mahmoud.h.safaan@gmail.com
2 Structural Engineering Department, Faculty of Engineering, Cairo University, Giza, Egypt
Email: mmarzouk@cu.edu.eg
3Faculty of Engineering and Technology, Badr University in Cairo (BUC), Badr City, Cairo, Egypt
Email: mohamed.marzouk@buc.edu.eg
Abstract #
Recent urban development requires advanced utility management through modern technology implementation to optimize utility management with minimal risks. While commonly used, traditional methods are often time-consuming and prone to human errors, leading to inefficiencies. This research proposes a comprehensive framework that leverages advanced technologies, specifically Ground Penetrating Radar (GPR), Mask R-CNN Deep Learning Model, and Augmented Reality (AR), to automate and enhance the process of subsurface utility detection and visualization. The framework is validated through the implementation of a case study where data from GPR scans are processed to detect and visualize buried utilities. The case study demonstrates the efficiency of integrating deep learning techniques with GOR data, significantly improving the accuracy of utilities detection. On the other hand, the use of AR-enabled seamless visualization of these results, offering an interactive experience for field operations. This approach does not only reduce the risk of damaging existing utilities but also accelerates decision-making processes where the developed system demonstrates promising results, providing an efficient utility detection and visualization solution.
Keywords: Ground Penetrating Radar; Mask R-CNN; Augmented Reality;
1. Introduction #
The increasing complexity of urbanization and infrastructure development has directed the demand for precise mapping and detection of subsurface utilities to ensure efficient construction and maintenance practices. Traditional methods of subsurface utility detection often involve manual processes that are time-consuming, costly, and prone to errors. Subsurface Utilities, such as pipelines and cables, are essential infrastructure components that form the essence of modern society’s lifeline and play a pivotal role in society’s socioeconomic growth. Thus, maintaining and preserving the utilities is vital and becoming more definite. However, due to the population growth and density increase in municipalities, it is a necessity to upgrade existing utilities and relatively increasing utilities complexity where these construction or maintenance works could pose a great length of risk to existing utilities.
In Egypt alone, the water network is estimated at 180,000 km, providing 33.6 million m3/day, while the sewage network is estimated at 55,000 km connected to Waste Water Treatment Plants with an actual capacity of 13.7 million m3/day [1]. Moreover, the lengths of cables were estimated at 604,956 km in 2021, with an increase of 2.2% from the previous year [2]. Whilst these figures do not include Fibre Optic and Gas networks, they highlight the complexity of subsurface utilities and the critical need for proper maintenance. Thus, congested utilities and the demand for upgrades or new installations make this task challenging promotes effective detection, mapping, and visualization methods that is essential to minimize risks like service disruptions, safety concerns, and regulatory impacts. These challenges have led to the adoption of advanced technologies such as Ground Penetrating Radar (GPR) for accurately detecting and mapping utilities, ensuring informed decisions in planning and construction.
GPR has emerged as a valuable technology in utility management by offering a non-destructive and efficient investigation of subsurface utilities by accurately identifying subsurface utilities of various materials at various depths. The fundamental operating principle of GPR involves the transmission of electromagnetic pulses into the ground and the reception of the reflected signals, which have penetrated the subsurface and are reflected with an amplitude that varies based on the dielectric properties of different materials that caused the reflections. By processing the recorded signals, a detailed cross-sectional image of the subsurface, also known as radargrams, can be generated [3], [4]. The process of operating principle is completed using several instruments, which are listed as follows: a transmission antenna that emits radar pulses, a recipient antenna to receive reflected signals, a control unit that manages the timing of pulse generation and processing reflected signals and a data recording device to store the collected information for further analysis [5].
Furthermore, GPR data analysis involves interpreting the collected signals to create radargrams by defining the characteristics of reflected signals and correlating them and enhancing the signal quality by applying time-slice analysis and various filters – will be discussed thoroughly in the following chapters – to obtain valuable information for mapping and locating subsurface utilities [4], [5]. Jaw and Hashim [6] have categorized GPR technology into two categories, namely: traditional GPR configured in “look-down” mode and in-pipe GPR configured in “look-out and look-through” mode. Traditional GPR consists of three main types:
- Time domain: uses short electromagnetic pulses and measures the time for signals to reflect back,
- Frequency domain: consisting of Frequency Modulated Continuous Waveform (FMCW), Stepped Frequency Continuous Waveform (SFCW), and Noise Modulated Continuous Waveform (NMCW), each utilizing different frequency variations for enhanced subsurface analysis, and
- Spatial domain: uses fixed frequencies for shallow investigations, often applied in concrete assessments.
Generally, GPR systems use a transmitter antenna to broadcast radio waves (10 MHz–1.5 GHz). Higher frequencies provide better resolution but less depth. The signal travels through a medium until it either attenuates or hits an object, reflecting back to the receiver antenna, which records the signal’s amplitude and duration. A time management unit coordinates the signal generation and detection by synthesizing time domain responses using the frequency domain. [7], [8], [9]. This principle is applied to all GPR configurations which are namely Reflection Profiling, Common Midpoint or Common Depth Point, Wide Angle Reflection and Refraction, and Trans-illumination. The GPR principle prompts for a non-invasive method for detecting subsurface objects without digging or drilling, making it ideal for preliminary surveys and minimizing the risk of damage to utilities and structures. It provides high-resolution imaging, detecting small, shallow objects in detail. The technology enables real-time data acquisition and processing, allowing for immediate interpretation and decision-making, which is especially useful in time-sensitive projects.
Recent advancements in GPR technology focus on improving data processing, interpretation, and integration with other geospatial technologies by developing multi-frequency antennas to enhance the accuracy, efficiency, and usability of GPR in various applications. Moreover, integrating GPR data with Geographic Information Systems (GIS) and Building Information Modelling (BIM) allows for more comprehensive mapping and management of subsurface utilities and infrastructure and provides a comprehensive view of the built environment.
2. Proposed Framework #
The proposed framework aims to address challenges related to the complexity of interpreting GPR data and interpretation visualization by leveraging GPR data and deep learning techniques, especially the Mask R-CNN model, for the automatic detection of buried utilities. Furthermore, the framework utilizes AR for the visualization of processed detections obtained from the trained model. This innovative approach combines the strengths of GPR, deep learning, and AR to provide a comprehensive solution for utility detection and visualization. The proposed approach integrates the GPR raw data, which represents the reflected signals from subsurface utilities, and leverages the unique ability of GPR to detect both metallic and non-metallic utilities. Furthermore, the raw data is introduced to modules for data decryption and further processing and filtering.
Due to the complexity of GPR data interpretation, deep learning techniques are utilized to automate the interpretation by using a supervised learning and segmentation model that is effective in pattern recognition tasks. To achieve this target, the framework utilizes Mask R-CNN, a state-of-the-art deep learning model, for pixel-level detection and segmentation of hyperbolic and attention change features in GPR data indicating the presence of buried objects. The detected objects are then visualized using AR technology that merges real and virtual worlds to produce a new environment where physical and digital objects co-exist and interact in real-time. Thus, allowing an immersive visualization and enhancing the understanding and interpretation of the results. Hence, the purpose of the proposed framework is to automate subsurface utilities detection and visualization by targeting two main objectives: 1) identify, in an automatic technique, buried utilities using GPR data, and 2) visualize processed detections obtained from the trained model using Augmented Reality. The first objective is achieved through utilizing the modern deep learning model, Mask R-CNN, for pixel-level detection and segmentation of hyperbolic features indicating existing utilities. This is achieved by executing the following stages: 1) GPR data collection and processing, 2) Mask R-CNN model training and inference, and 3) Object Detection and post-processing.
Moreover, the AR visualization process involves project setup, scene design, spatial mapping and interaction, anchoring and tracking, User Interface (UI) and visual effects, and HoloLens features integration. Figure 1 illustrates the proposed framework stages and processes, which are explained to provide a comprehensive understanding of their processes and their significance in achieving the proposed framework’s objectives.
Figure 1: Proposed Framework Flowchart
The data collection and processing stage within the proposed framework serves as the foundational stage upon which the subsequent stages’ analysis and interpretations are built. It involves a series of stages to extract the most insights from the GPR data (see Figure 2). This stage involves GPR data collection, representing subsurface objects and voids based on signal attenuation. The process begins by scanning known utility locations and cross-referencing with as-built data. Key factors such as antenna frequency and time window selection optimize depth and resolution.
Raw data decryption follows, as GPR devices store proprietary signal data, a custom decryption algorithm converts the data into a usable format. Data from multiple GPR sensors is then merged using a spectral forecast algorithm, ensuring uniform sampling rates. Afterwards, processing is performed, including noise filtering, signal correction, and SNR-based filtering, to enhance data quality and reliability, ultimately generating B-Scan images for further analysis.
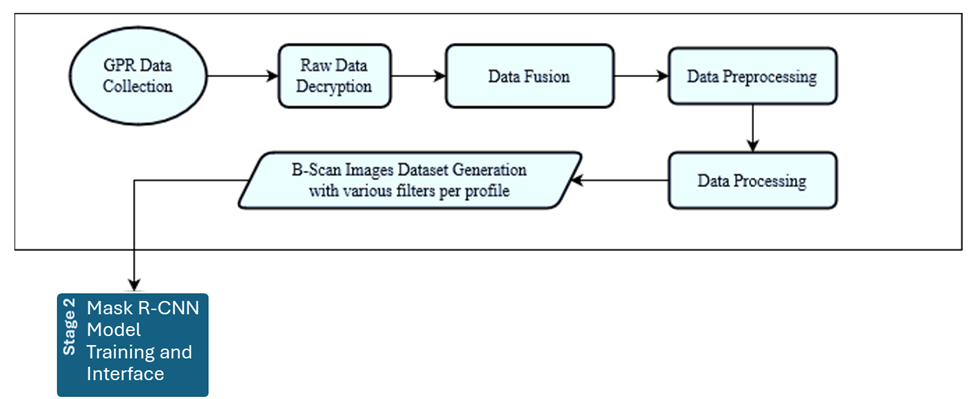
Figure 2: Data Collection and Processing Process.
The second stage of the proposed framework involves training a Mask R-CNN model for object detection and instance segmentation by extending Faster R-CNN with a segmentation mask branch for each Region of Interest (RoI). This stage provides a trained model for future projects and includes several key processes (see Figure 3).
First, a database of training, validation, and testing datasets is created, with labels for masks indicating regions of interest in B-Scan images, formatted in COCO JSON [10], which contains signatures mask coordinates, labels category, and bounding box coordinates. The annotated data is split into training and validation sets, with the former used for training and the latter for model evaluation and tuning. Before training, the following processes are considered:
- Model selection: ResNet-50 is chosen for its balance of performance and complexity,
- Model Configuration: the model is set for four classes (hyperbola, other objects, noise, and background) with additional parameter configurations.
While incorporated processes during the training are allocated involves:
- Transfer learning by utilizing pre-trained weights from the COCO dataset is used to initialize the model for faster convergence,
- Data augmentation, which involves techniques like cropping, scaling, and brightness adjustments, are applied to prevent overfitting and expand the dataset and
- Training metrics, which are built-in functions to monitor Total Loss and accuracy.
Based on the best-trained model, acquiring detected objects is performed on obtained data and undergoes postprocessing to remove duplicated masks located within the same region using Non-Maximum Suppression (NMS).
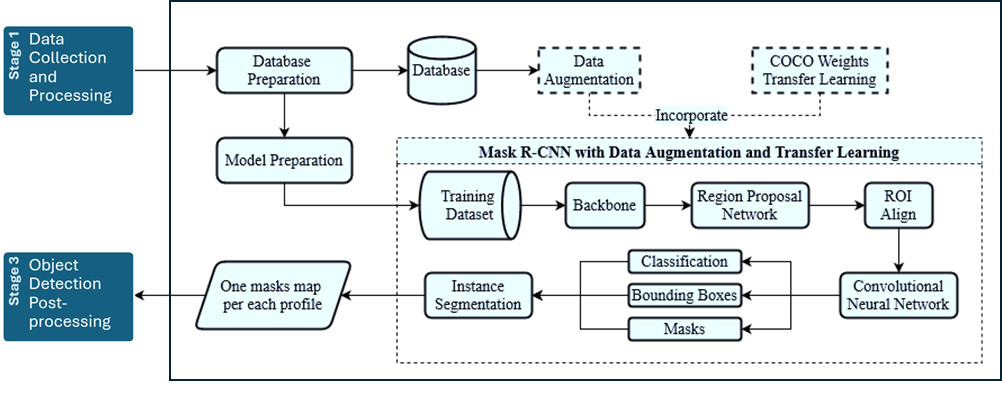
Figure 3: Mask R-CNN Training and Inference Process
The third stage enhances detected objects, translating model detections into actionable spatial point clouds for user visualization (see Figure 4). Since the inference for object detection is performed on multiple filtering configurations for each profile, the first step in this stage is obtaining common features across multiple filtering configurations that are merged into one image by generating a binary instance matrix based on coordinates, removing instances that don’t meet a repetition threshold.
The following step aligns all profiles, ensuring they share the same start and end points using Common Feature Extraction, adjusting each profile based on a reference. Post-processing removes masks that don’t meet repetition thresholds to minimize false positives. The filtered masks are then converted into a binary matrix, where each active cell is translated into coordinates, factoring in depth (wave travel time) and profile spacing. This creates a 3D point cloud representing detected utilities. Finally, model evaluation is performed using the mean Intersection over Union (mIoU) method.
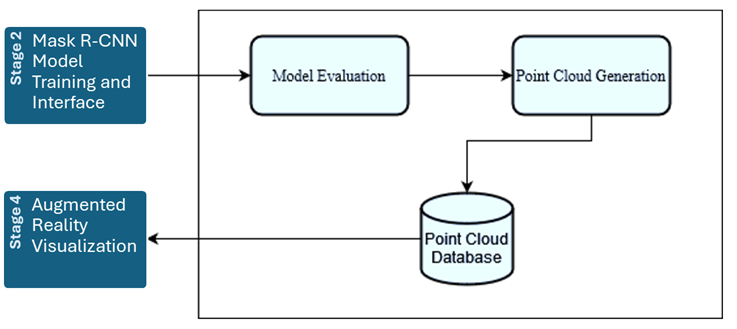
Figure 4: Feature Extraction Process
The final stage visualizes the object detection output and point cloud database through AR, involving several processes (see Figure 5). Initially, appropriate software and hardware are selected to ensure compatibility, using MS HoloLens [11] and Microsoft’s Mixed Reality Toolkit (MRTK) for Unity [12]. This setup aids cross-platform AR app development while ensuring seamless integration of core functions.
The next step involves designing the virtual scene using Unity Scene View to position models, cameras, and lighting. Spatial mapping with HoloLens uses embedded cameras and sensors to create a 3D model of the physical environment, enabling interactions between virtual and real-world objects. Visual effects and user interface enhancements, such as floating control docks and informational text, increase realism and immersion. Finally, HoloLens features like gesture recognition and voice commands are integrated to boost interactivity and user engagement.
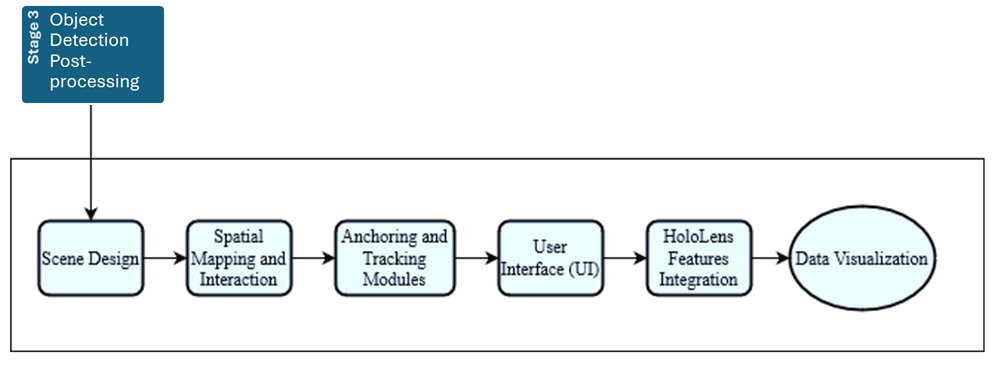
Figure 5: Augmented Reality Visualization Process
3. Case Study #
The proposed framework is applied in a real-life case study to demonstrate its practicality and effectiveness in Mostakbal City, New Cairo, Egypt (see Figure 6). The city is planned over 5,200 acres across three phases. The focus is on the first phase (1,490 acres), where most utility construction was completed. The implementation follows the model development stages: 1) Data collection and processing, 2) Mask R-CNN model training and inference, 3) Object detection and post-processing, and 4) AR implementation. Each stage employs appropriate tools and software. The second and third phases cover 1,607 and 1,875 acres, respectively, serving residential areas and regional service centres.
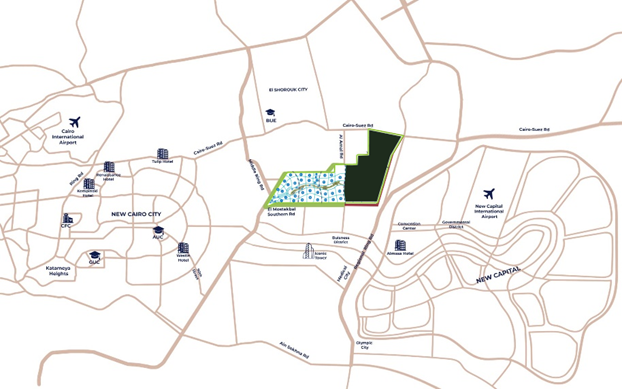
Figure 6: Mostakbal City Location
3.1 Data Collection and Processing #
The data collection process for the model implementation involved the use of an IDS RIS MF Hi-MOD GPR system with two antennas. The first one is 400MHz to provide high penetration depth while the second one is 2,000MHz to provide high resolution for shallow depths. These selections were based on the as-built utilities located at the scanned areas, which are set as a reference for data annotation which showed that utilities such as water main and irrigation main are within a depth of 2.50-meter, gas lines within 2.0 meters, and electric duct banks within 1.20 meter. At the same time, some other sub-main utilities are located within 1 meter. The GPR system scans various sites within phase one of Mostakbal City for two purposes: 1) to obtain training and validation data for Mask R-CNN model training and 2) to acquire unseen data for measuring the framework’s performance and complete implementation, including AR visualization. A total of 114 profiles are scanned and divided into two sets. The first set comprises 54 profiles, averaging 30 meters, in areas with congested utilities for training and validation. The second set consists of 60 profiles, averaging 20 meters, featuring two duct banks for performance measurement and full framework application. Figure 7 provides a schematic of buried utilities at the case study site.
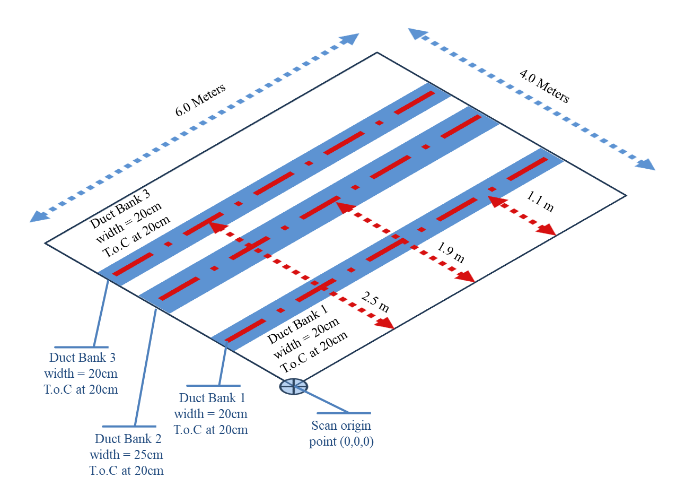
Figure 7: Schematic Representation of Buried Utilities at Case Study Location
Raw Data Decryption process involves converting raw GPR data into a format suitable for processing and interpretation. Each GPR hardware vendor provides proprietary software for data decryption, but this limits third-party processing. By reverse-engineering the IDS RIS format stored in *.DT files, data decryption becomes possible. The process starts by reading the file’s header to determine scan parameters, then extracting data from the data section using a HEX editor to understand its format and address ranges (see Figure 8).
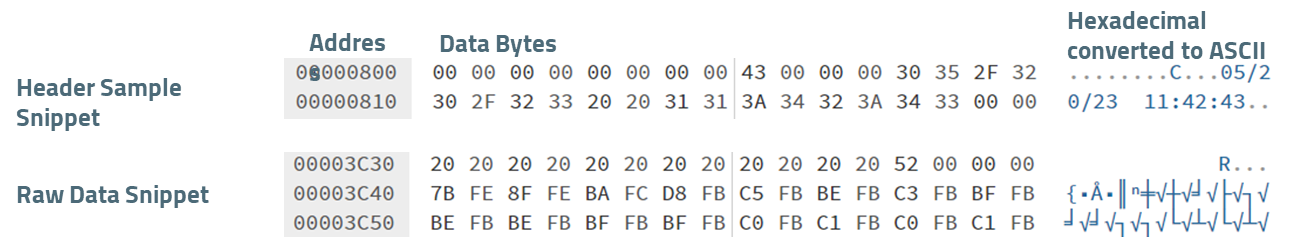
Figure 8: Snippet Sample of The Header and Raw Data Sections
The data fusion process combines multiple data sources to produce more consistent and comprehensive information than a single source. It starts with signal resampling, which is crucial for integrating GPR data from sensors with differing frequencies. Resampling standardizes the temporal domain, enabling dataset integration and comparison by adjusting signals to a common frequency using Python’s Scipy library’s “signal.resample” function. The resampled dataset is organized into a structured format with trace count, time window, positions, and frequency characteristics, enhancing data accuracy and reducing redundancy.
After obtaining and decrypting the scan data, data processing enhances the signal-to-noise ratio and minimizes distortions for efficient interpretation. The preprocessing begins by applying noise filters to remove unwanted signals, including system noise between antennas, wave interference, material reflections, and external EM interference. Wavelet transform and A-Scan analysis use:
- Low Amplitude Filtering: Utilizes “low_pass_filter” to eliminate signals outside specific amplitude thresholds.
- Dewow Filtering: Suppresses low-frequency noise and removes long-term drifts caused by external factors.
3.2 Mask R-CNN Model Training and Inference #
The second stage of the framework involves utilizing deep learning to interpret GPR data automatically. The processes involved in the deep learning integration stage start with data and deep learning model preparation and training the model while incorporating data augmentation and transfer learning and using the trained mode to provide object detection through inference and post-processing of the output detected objects. The processes of Mask R-CNN training and inference, along with their inputs and outputs, are listed in Table 1.
| Process | Input | Output |
| Mask R-CNN Data Preparation | B-Scan images of fused datasets with different filtering configurations for each profile. | Training and Validation database. |
| Model Preparation and Training | Training and Validation Database. | Trained Mask R-CNN Model. |
| Inference and post-processing | Testing dataset. | Processed segmented instances detection. |
| Features Extraction | Detected objects of all profiles’ filtering configurations. | Binary instance array for each profile. |
| Profiles Alignment | B-scan of each profile | Shifted B-scans with aligned profiles. |
| Point Cloud Generation | Shifted B-scans with aligned profiles and thier features. | Point cloud with pixel reduction. |
Table 1: Mask R-CNN Model Training and Inference Processes Input and Output List
3.2.1 Data Preparation
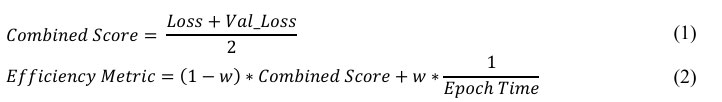
The data preparation process includes dataset processing, data annotation, and database generation. Although dataset processing is redundant for this model, it’s useful for external datasets using B-scans with padding or titles, as data augmentation could impact training. Data annotation is done using Makesense.ai, a free, open-source web app that supports multiple label types like bounding boxes, lines, and polygons. Annotations can be exported in formats like VGG JSON or CSV. Once data annotation is complete, model preparation begins by selecting and configuring the appropriate model. Mask R-CNN is chosen for its configurability and pixel-level object detection capabilities, and ResNET-50 is chosen as its base architecture for efficiency and performance. The result is a trained model ready for analysis to identify the best-performing configuration. The training process spans 100 epochs, starting with initial transfer learning using a COCO-trained model. Additional transfer learning occurs after epochs 60 and 80, accounting for the spikes in the learning curve shown in Figure 9.
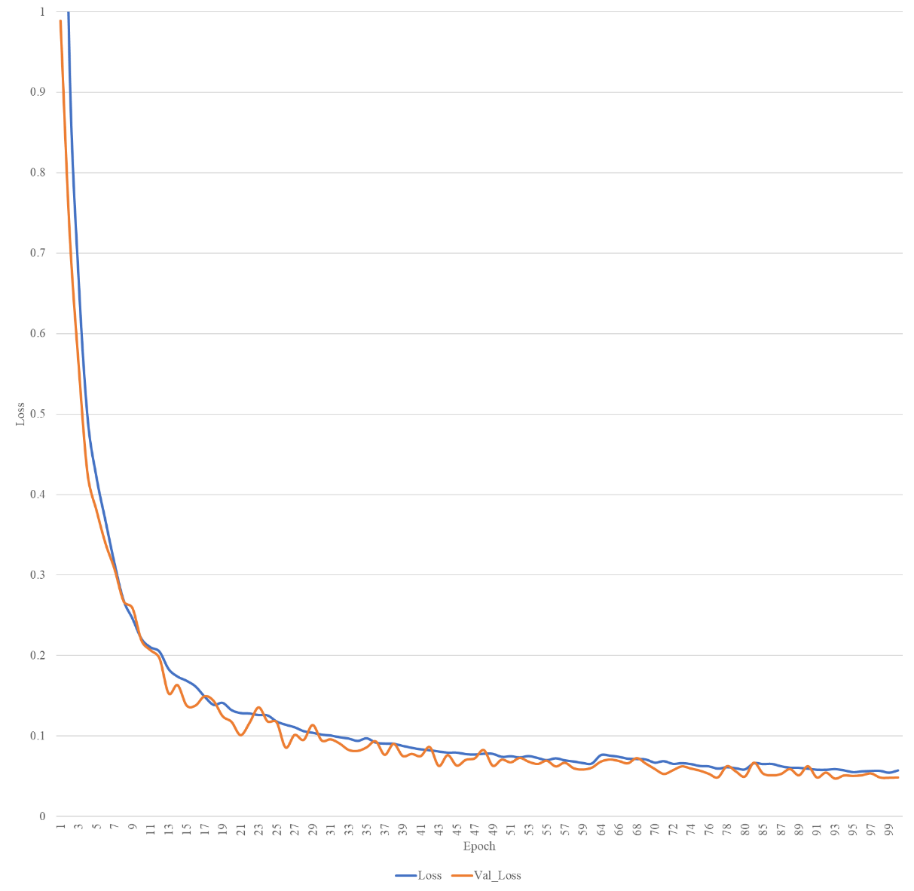
Figure 9: Model Training Loss and Validation Loss
3.2.2 Inference and Detections Post-processing
During training, each epoch includes a training and validation loss function. Epoch run time is calculated from the processor time difference between start and end. These metrics assess model performance, with lower loss values indicating better performance. Plotting these metrics visualizes convergence and helps identify the lowest validation loss without overfitting (see Figure 10). The first three epochs of each transfer learning stage are removed to manage spikes. The assessment utilized Equations (1) and (2) to show that model 93 is the best-trained model.
 Model 93 detects utility locations using a function that applies trained weights, generating masks on radargram images through:
- Reading radargram images.
- Running the object detection function for mask instances.
- Exporting detected masks as arrays for post-processing.
Accordingly, the post-processing involves three steps:
- Mask Refinement: Retain masks meeting thresholds across configurations, generating a binary instance array. Masks not meeting thresholds are removed, producing one binary instance array per profile (Figure 11).
- Profile Alignment: Align profiles to common start and end points by setting a datum profile, extracting features, determining reference points, and applying shifts. Metallic tapes in data collection marked profile boundaries for alignment.
- Pixel Reduction and Point Cloud Generation: Reduce pixels to enhance AR model performance and generate a point cloud.
Table 2 illustrates the process utilized to perform post-processing on obtained masks while Table 3 illustrates the point cloud generation process.
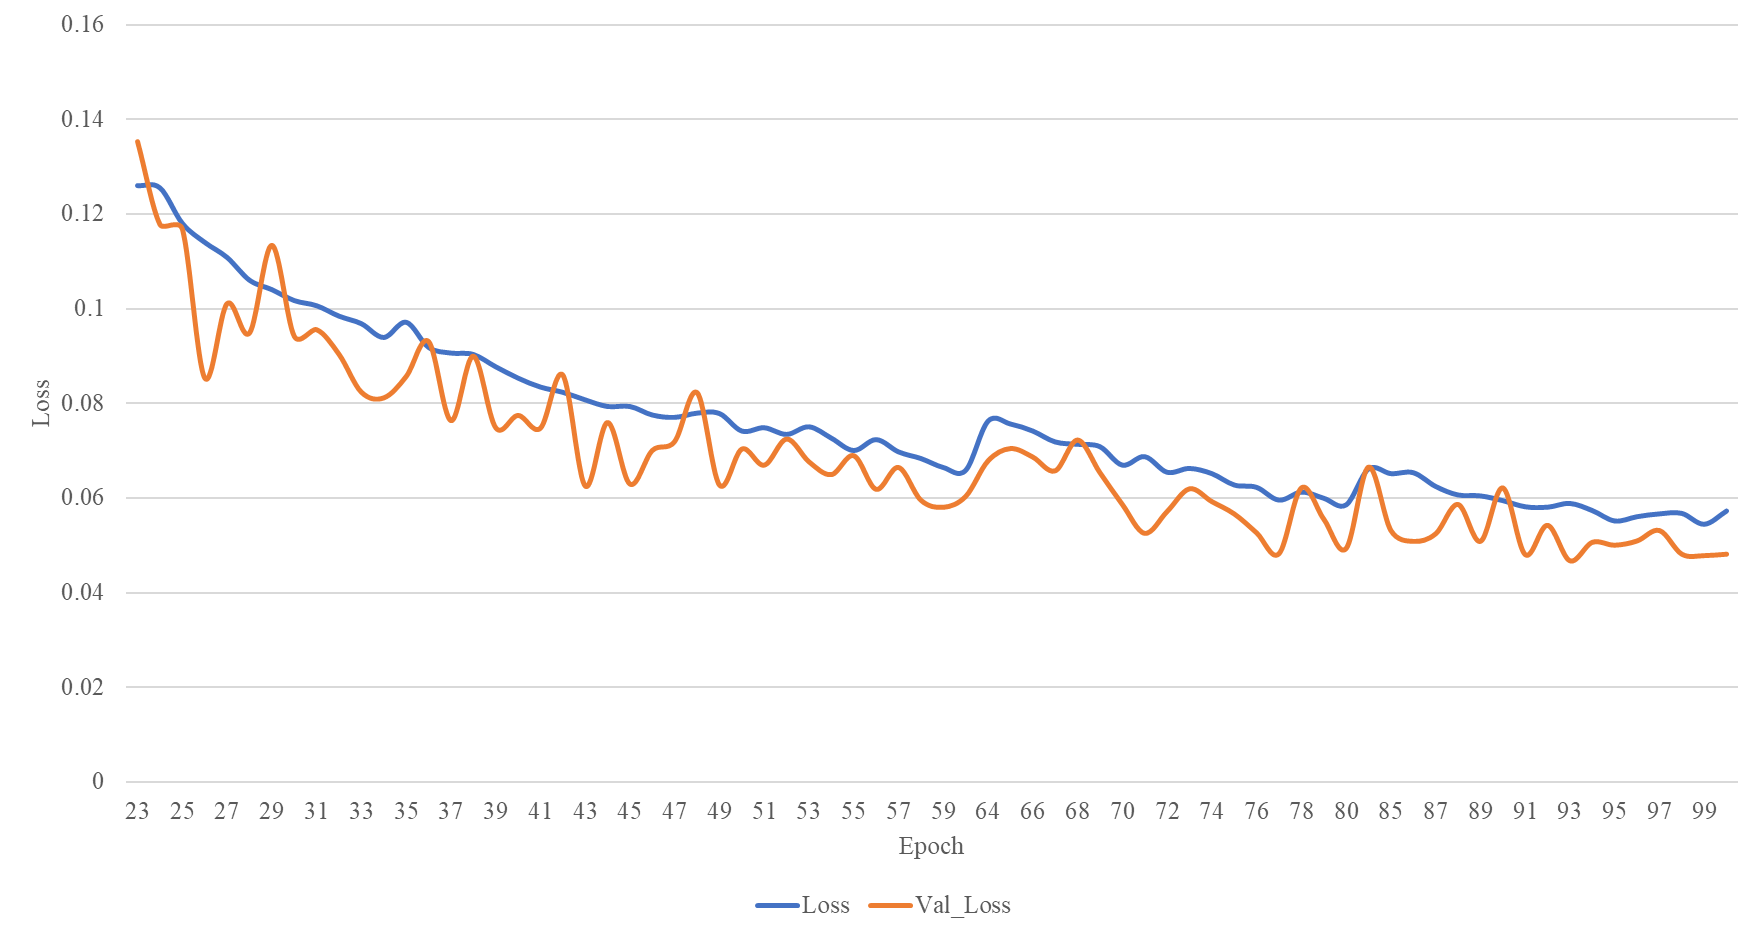
Figure 10: Model Preparation and Training Process
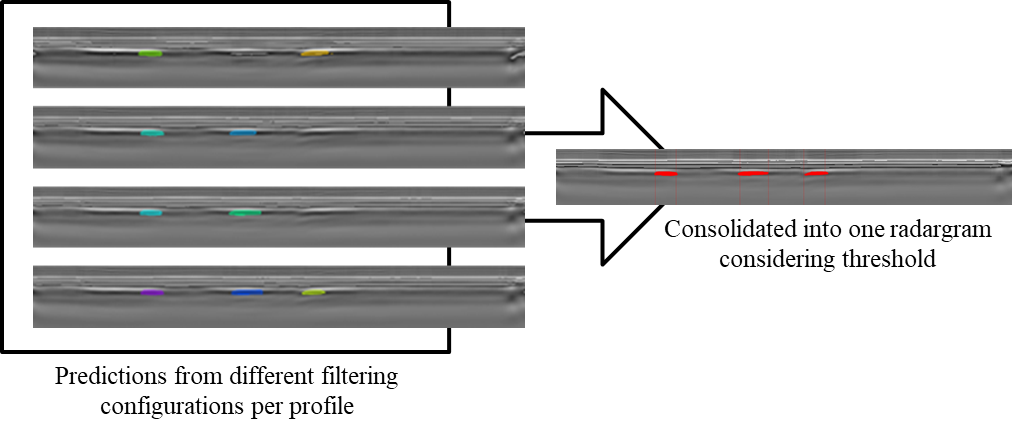
Figure 11: Feature Extraction and Retention of Valid Masks
| Input | Detected objects obtained for each configuration for each profile
|
|
| Process |
|
|
| Output | Binary mask filtering only regions of interest.
|
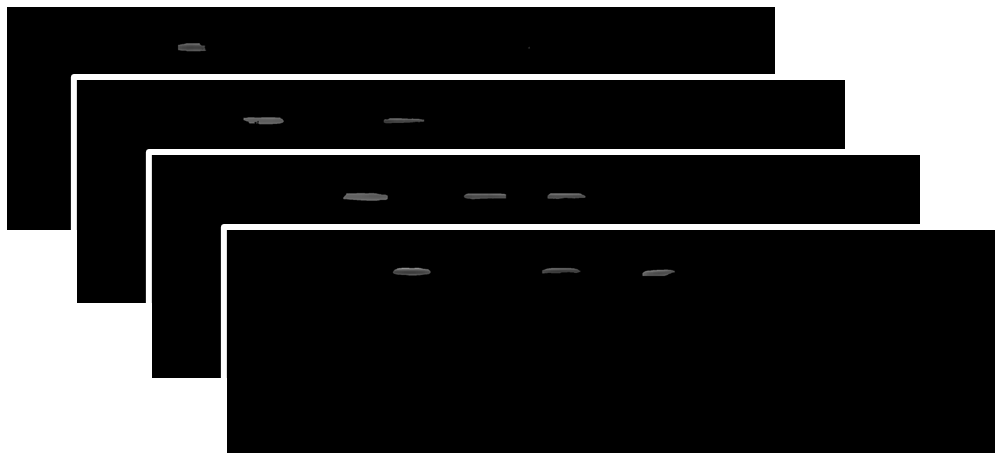
Table 2: Inference Post-processing Process
| Input | Filtered binary mask for each profile. | |
| Process |
|
|
| Output | Point cloud of the processed detected objects’ masks.
|
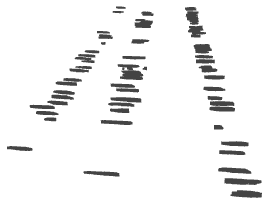
Table 3: Point Cloud Generation Process
3.3 Augmented Reality Visualization #
The stage includes the use of several tools and preparation that are crucial for the development of the application, the development requires the installation of a number of software packages (e.g., Adobe Illustrator, Visual Studio, Unity Hub, etc.) to configure the project for AR by setting MR project, scene, and UWP Capability settings, creating a Main Camera with attached scripts for user interaction (see Figure 12). Subsequently, the next step involves creating objects that match the application’s wireframe (see Figure 13). These objects serve as the application’s front-end, with scripts providing back-end functionality, which involves designing and applying VuMarks as materials to game objects (see Figure 14). This results in objects and user interface shown in Figure 15. The final stage involves building and deploying the AR application to the HoloLens, as depicted in Figure 16.
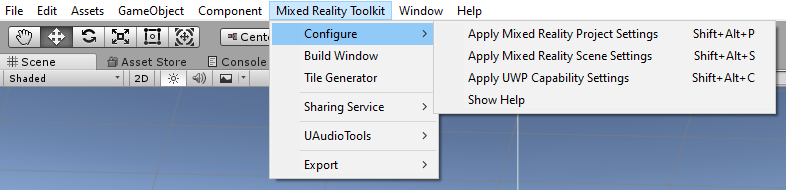
Figure 12: Project Configuration

Figure 13: Planning Scene Using Wireframe
![]()
Figure 14: VuMark Employed in The Research
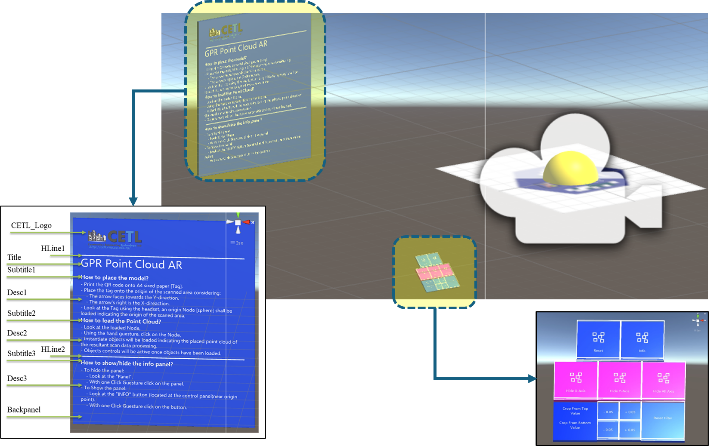
Figure 15: AR Application Scene Components
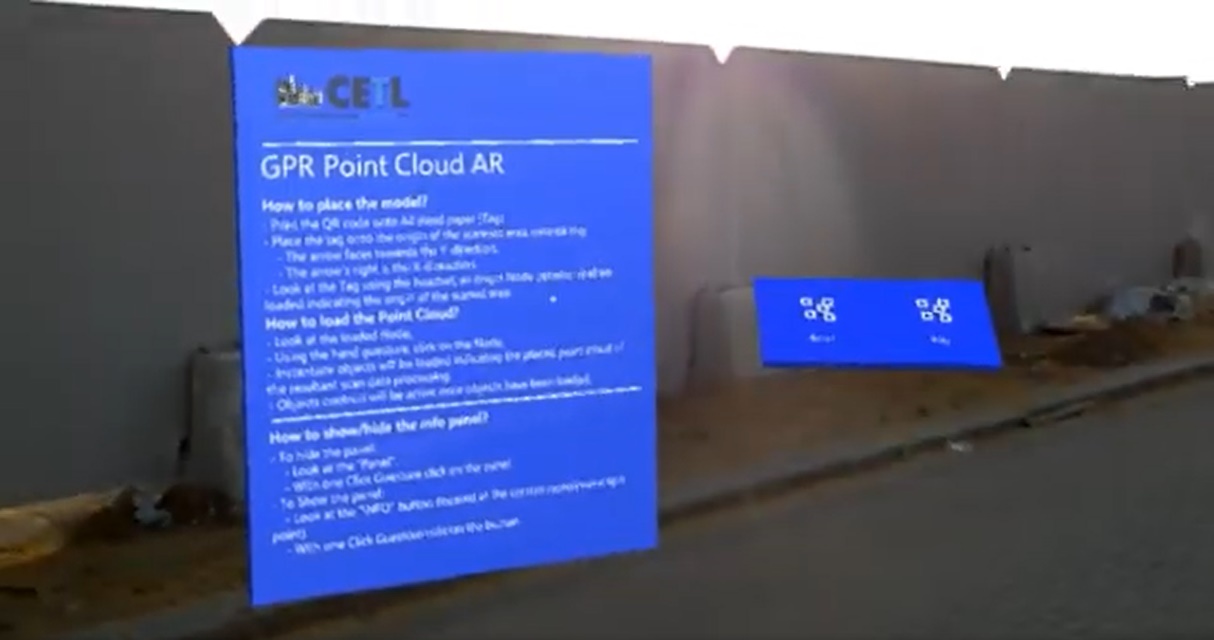 |
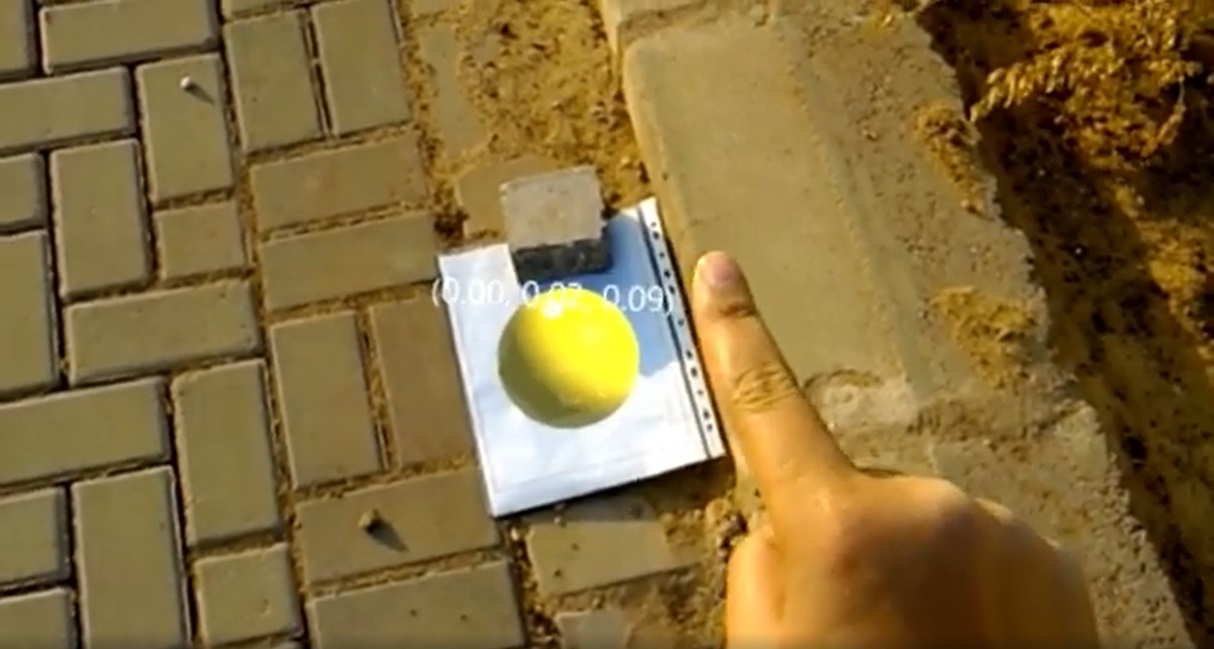 |
| a) Initiation of The Application | b) Initiating Loading of Point Cloud |
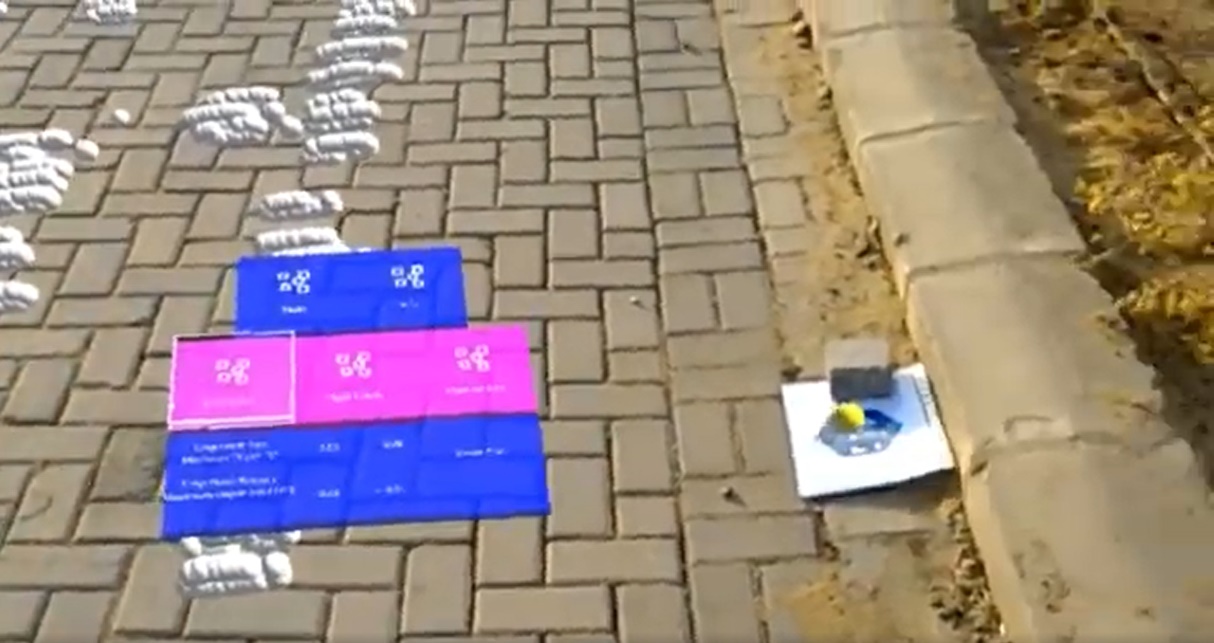 |
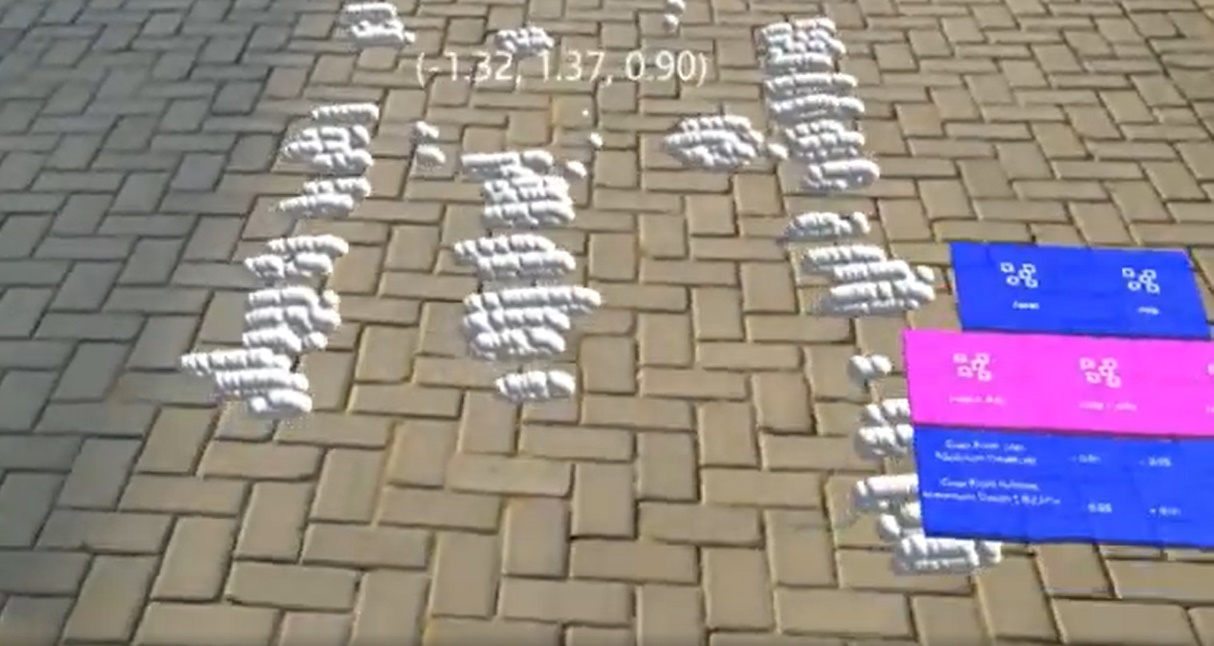 |
| c) Application UI After Loading Point Cloud | d) Visualizing Point Cloud Coordinates Data |
Figure 16: Building and Deploying the AR Application to the HoloLens
Conclusion #
This research proposed a novel framework that integrates deep learning techniques and augmented reality to automate the interpretation of GPR data to detect and visualize subsurface utilities in urban environments. The framework addresses the increasing complexity of infrastructure development and the demand for precise mapping and detection of subsurface utilities, minimizing interruption of services and maintaining high service quality to mitigate socioeconomic impacts. The framework is shaped to address the purpose of the research, to reduce manual intervention by automating the process of subsurface utility detection accurately and in the most efficient way, elevating the current practices to meet modern technologies. The framework addresses the traditional methods of visualization of the subsurface utilities by integrating augmented reality to enhance the visualization and provide users with a more intuitive and immersive understanding of the results. Thus, it explores the potential of combining advanced technologies to revolutionize the current methods of subsurface utilities detection and mapping, which improve decision-making processes while ensuring the safety and efficiency of subsurface utilities management.
References #
[1] E. Water and R. Agency, “Annual Report N° 14 Egyptian Water Regulatory Agency (EWRA),” 2022.
[2] Egypt Electricity Holding Company (EEHC), “Annual Report Year 2020/2021,” 2021. [Online]. Available: http://www.moee.gov.eg/test_new. Accessed 1 Feb 2022
[3] W. Wai-Lok Lai, X. Dérobert, and P. Annan, “A review of Ground Penetrating Radar application in civil engineering: A 30-year journey from Locating and Testing to Imaging and Diagnosis,” NDT E Int., vol. 96, pp. 58–78, 2018, doi: 10.1016/j.ndteint.2017.04.002.
[4] P. Zhang, X. Guo, N. Muhammat, and X. Wang, “Research on probing and predicting the diameter of an underground pipeline by GPR during an operation period,” Tunn. Undergr. Sp. Technol., vol. 58, pp. 99–108, 2016, doi: 10.1016/j.tust.2016.04.005.
[5] H. Li, C. Chou, L. Fan, B. Li, D. Wang, and D. Song, “Toward Automatic Subsurface Pipeline Mapping by Fusing a Ground-Penetrating Radar and a Camera,” IEEE Trans. Autom. Sci. Eng., vol. 17, no. 2, pp. 722–734, 2020, doi: 10.1109/TASE.2019.2941848.
[6] S. W. Jaw and M. Hashim, “Locational accuracy of underground utility mapping using ground penetrating radar,” Tunn. Undergr. Sp. Technol., vol. 35, pp. 20–29, 2013, doi: 10.1016/j.tust.2012.11.007.
[7] S. Kuo, “Investigation of Ground Penetrating Radar for Detection of Leaking Pipelines Under Roadway Pavements and Deveopment of Fiber-Wrapping Repair Technique,” University of Central Florida, 2004.
[8] H. R. Burger, A. F. Sheehan, and C. H. JONES, Introduction to applied geophysics : exploring shallow subsurface. W. W. Norton & Company, Inc., 2006.
[9] B. Maruddani and E. Sandi, “The development of ground penetrating radar (GPR) data processing,” Int. J. Mach. Learn. Comput., vol. 9, no. 6, pp. 768–773, 2019, doi: 10.18178/ijmlc.2019.9.6.871.
[10] K. He, G. Gkioxari, P. Dollár, and R. Girshick, “Mask R-CNN,” in IEEE Transactions on Pattern Analysis and Machine Intelligence, 2017, pp. 2961–2969. doi: 10.1109/TPAMI.2018.2844175.
[11] Microsoft, “About HoloLens 2.” Accessed: Mar. 30, 2024. [Online]. Available: https://learn.microsoft.com/en-us/hololens/hololens2-hardware
[12] S. Ong and V. K. Siddaraju, Beginning windows mixed reality programming: For HoloLens and mixed reality headsets, Second Edi. 2021. doi: 10.1007/978-1-4842-7104-9.
[13] P. A. Gagniuc et al., “Spectral forecast: A general purpose prediction model as an alternative to classical neural networks,” Chaos An Interdiscip. J. Nonlinear Sci., vol. 30, no. 3, 2020, doi: 10.1063/1.5120818.


