


Young-Su Kim1, Jae-Hwa Jung1, Ji-Hoon Park1, Eng. Mahmoud Zain1, Omar Al-Ghamdi2, Faisal Al Ruhaily2
1APM Technologies, Inc., Gyeonggi-do, Korea.
gongja85@apmtech.co.kr, adonis@apmtech.co.kr, jhpark@apmtech.co.kr, mzain@apmtech.co.kr
2GCC Electrical Testing Laboratory, Saudi Arabia
Omar.alghamdi@gccelab.com , Faisal.alrehaily@gccelab.com
Abstract #
Monitoring the transformer’s condition and fault diagnosis are essential to maintain the reliable operation of the transformer and maximize its lifespan. Usually, detecting PD signal from UHF PD sensor installed in a transformer is a method for monitoring the transformer conditions. However, the PD The PD signals leaked from Transformer will be detected by PD sensors due to peripheral high voltage. And it could be mistaken for as PD signal occurred in the transformer. In this paper, through experimental analysis, we propose a technology that installs several heterogeneous PD sensors in a transformer and a peripheral high voltage device and processes PD signals simultaneously to distinguish between PD signals generated inside a transformer and PD signals generated in peripheral high voltage devices. Several heterogeneous PD sensors, such as UHF sensors, TEV sensors, and HFCT sensors, are installed in transformers and peripheral high voltage devices, and the normalized amplitude of PD signals received from each sensor are compared and analyzed on a synchronized time and phase axis. For example, if the PD signals detected by the transformer and the peripheral high voltage device are on the same time and phase axis, and the normalized amplitude of PD signal from transformer is larger than the normalized amplitude of PD signal from the peripheral high voltage device. At this time, this PD signal is determined to have occurred inside the transformer. Whereas, if the normalized amplitude of the PD signal introduced from peripheral high voltage devices is larger than the normalized amplitude of the PD signal introduced from the transformer, it is determined to be PD signal introduced from the peripheral high voltage devices. With the results of experimental analysis, this technology can be effectively used to determine whether the detected PD signal from transformer PD sensor is originated from inside of the transformer or from peripheral high voltage device.
The authors are with APM Technologies Inc, #1010, 11 Geumto-ro 80beon-gil, Sujeong-gu, Seongnam-si, Gyeonggi-do, Korea. The corresponding author is Young-Su Kim and the contact e-mail is gongja85@apmtech.co.kr
Index Terms – Power Transformer, Heterogeneous PD Sensors, Partial Discharge, Pulse Gating
1. Introduction #
As the demand for electric power continues to increase, the demand and capacity of a transformer of power are growing, but to prevent an accident in a substation in advance and supply stable electric power is greatly increased. The biggest causes of failure of high voltage power facilities are insulator defects and aging, which may be detected by measuring partial discharge using suitable techniques.
Currently, the most frequently used technology to check the health status of the transformer is the DGA (Dissolved Gas Analysis) method. However, it is not easy to identify the symptoms from the beginning of the occurrence of the partial discharge because the partial discharge is activated to some extent until the change in the gas component caused by the partial discharge is detected [1-2]. To overcome these problems, there are technologies capable of monitoring partial discharge occurring inside a transformer from an early stage. Among them, the most widely adopted method is a technology that detects and analyzes electromagnetic waves generated during partial discharge. The core of this technology for detecting and analyzing partial discharge signals is a technology for distinguishing noise signals and partial discharge signals generated from peripheral signals [3-5]. Numerous technologies are researched and applied to distinguish internal and external noise signals of high voltage equipment from partial discharge signals, and RF filter design technology, noise gating technology, time and frequency domain signal processing technology, etc. are most commonly used.
Despite these advances in technology, the development of technology that effectively eliminates noise signal still present in broadband to distinguish only partial discharge signals is still a challenge for experts in this field [6]. For partial discharge signals that occur in such environments, when the amplitude of noise signal is larger than the amplitude of partial discharge signal or when the noise signal has impulse or corona characteristics from its peripheral high voltage devices, expert precision analysis is absolutely required. This means the occurrence of time and cost. Moreover, since transformers are generally outdoors, they are exposed to peripheral noise signals (Electromagnetic noise such as peripheral mobile phones, peripheral impulse or corona noise) that are absolutely diverse and large in amplitude compared to the GIS installed indoors. Therefore, the biggest solution to achieve the goal of distinguishing only partial discharge signals generated inside the transformer is to obtain new technologies to distinguish between peripheral noise signal and partial discharge signals generated inside the transformer.
In this paper, through experimental analysis, we introduce a technology that installs several heterogeneous PD sensors in a transformer and a peripheral high voltage device and processes PD signals simultaneously to distinguish between PD signals generated inside a transformer and PD signals generated in its peripheral high voltage devices. For PD signals detected by several heterogeneous PD sensors installed in the transformer and its peripheral high voltage devices, only PD signals generated inside the transformer can be extracted by comparing and analyzing the amplitudes on the synchronized time axes in the PRPD graph. Also, a method of distinguishing PD signals generated by transformers and its peripheral high voltage devices is demonstrated through experiments. Based on the results of this experiment, a technique for distinguishing PD signals generated by transformers and its peripheral high voltage devices can be useful for analyzing PD signals generated inside transformers more effectively than other techniques.
2. A method of finding PD source of transformer and peripheral high voltage devices using several heterogeneous PD sensors #
Figure 1 shows a method for solving the disadvantages of the conventional technology for detecting electromagnetic waves and analyzing PD signals as a block diagram. The signals detected from several heterogeneous sensors installed in transformers and peripheral high voltage devices remove the noise signal using a noise filter and then extract only the PD signal. The amplitude of the extracted PD signals is normalized and only PD signals generated inside the transformer are classified using pulse gating technology on the synchronized time axis.
Pulse gating technology is a technology that converts a signal detected by a sensor installed in a transformer and a signal detected by a sensor installed in a peripheral high voltage device into a normalized amplitude and logically removes the PD signal to extract only the PD signal generated inside the transformer.
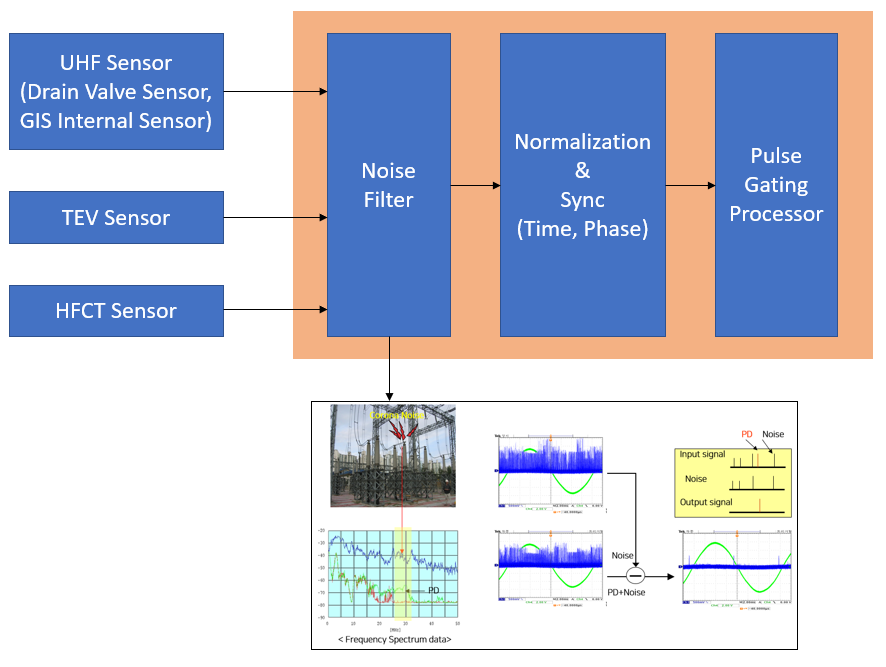
Fig. 1. Block Diagram of the proposed technology
Figure 2 shows the principle of pulse gating. As shown in Figure 2, PD signals are detected from several heterogeneous sensors installed in transformers and peripheral high voltage devices. Among the PD signals, red and green are PD signals generated by the peripheral high voltage device, and blue is PD signals generated inside the transformer. It can be seen that the PD signal detected from the sensor installed in the transformer is blue and green. The blue PD signal shows that the signal amplitude detected by the transformer is larger than that detected by the peripheral high voltage devices, and the green PD signal shows that the signal amplitude detected by the transformer is smaller than that detected by the peripheral high voltage devices. The red PD signal did not flow into the transformer and was not detected by the transformer. If the amplitude of PD signals detected from several heterogeneous sensors installed in transformer and peripheral high voltage devices is normalized and compared on a synchronized time axis and logically removed using pulse gating technology, only PD signals generated inside the transformer can be extracted.
(a)
(b)
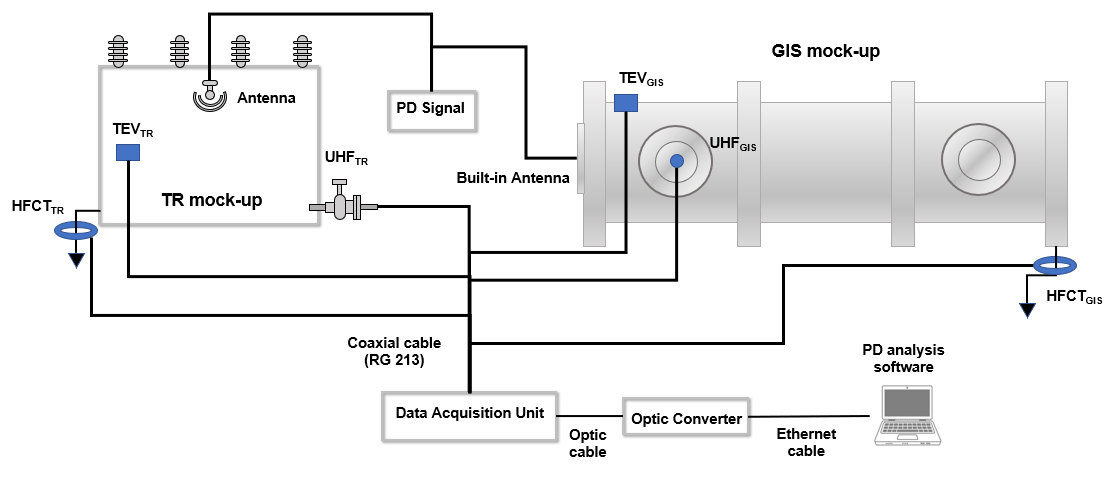
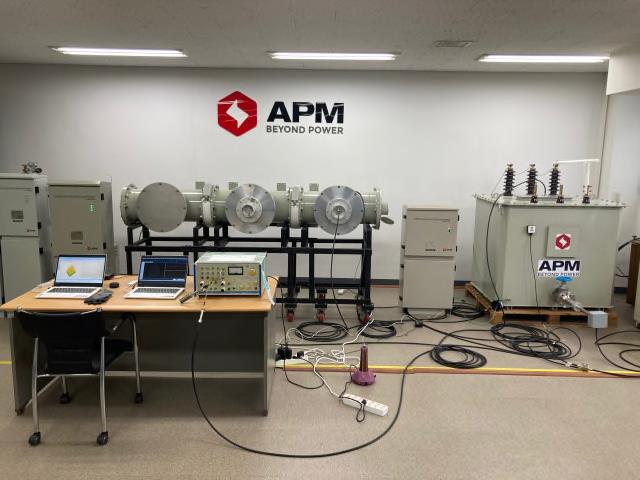
Fig. 3. (a) Experimental configuration diagram (b) Experimental Environment in Lab
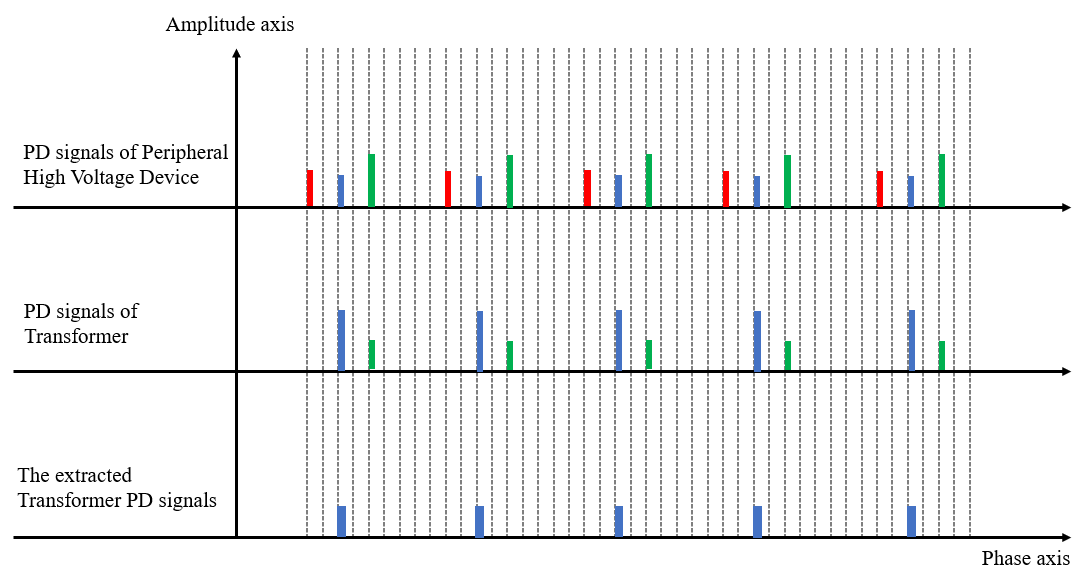
Fig. 2. PD signals of peripheral high voltage device, transformer and the extracted transformer PD signals
3. Experimental Environment & Results #
3.1 Experimental Environment & Method
In this section, we represent an experimental analysis of finding partial discharge source between transformers and peripheral high voltage devices using through several heterogeneous PD sensors based on the technology described in section 2.
Figure 3(a) shows the experimental configuration diagram. Figure 3(b) shows an experimental environment in Lab. The experimental methods to verify the technology are as follows.
As shown Figure 3, an experiment was conducted to distinguish PD signals source generated by the transformer or the peripheral high voltage devices using TR mock-up and GIS mock-up, respectively. In STEP 1, an experimental method for the case where a PD signal is generated inside a TR mock-up and in STEP 2, a PD signal is generated inside a GIS mock-up has been described, respectively.
STEP 1: PD Source in TR Mock-up
Install UHFTR, TEVTR, and HFCTTR in TR mock-up, and install UHFGIS, TEVGIS, and HFCTGIS in GIS mock-up. Install an antenna inside the TR mock-up and connect the PD generator to the antenna in order to generate a PD signal source inside the TR mock-up. At the same time, check whether the PD signal is detected by the UHFTR, TEVTR and HFCTTR, and after that, check whether the detected PD signal appears in the same phase or not. If PD signals are detected in both UHFTR, TEVTR and HFCTTR and occurred on the same time axis and phase, the detected PD signals can be interpreted as being generated inside TR Mock-up.
STEP 2: PD Source in GIS Mock-up
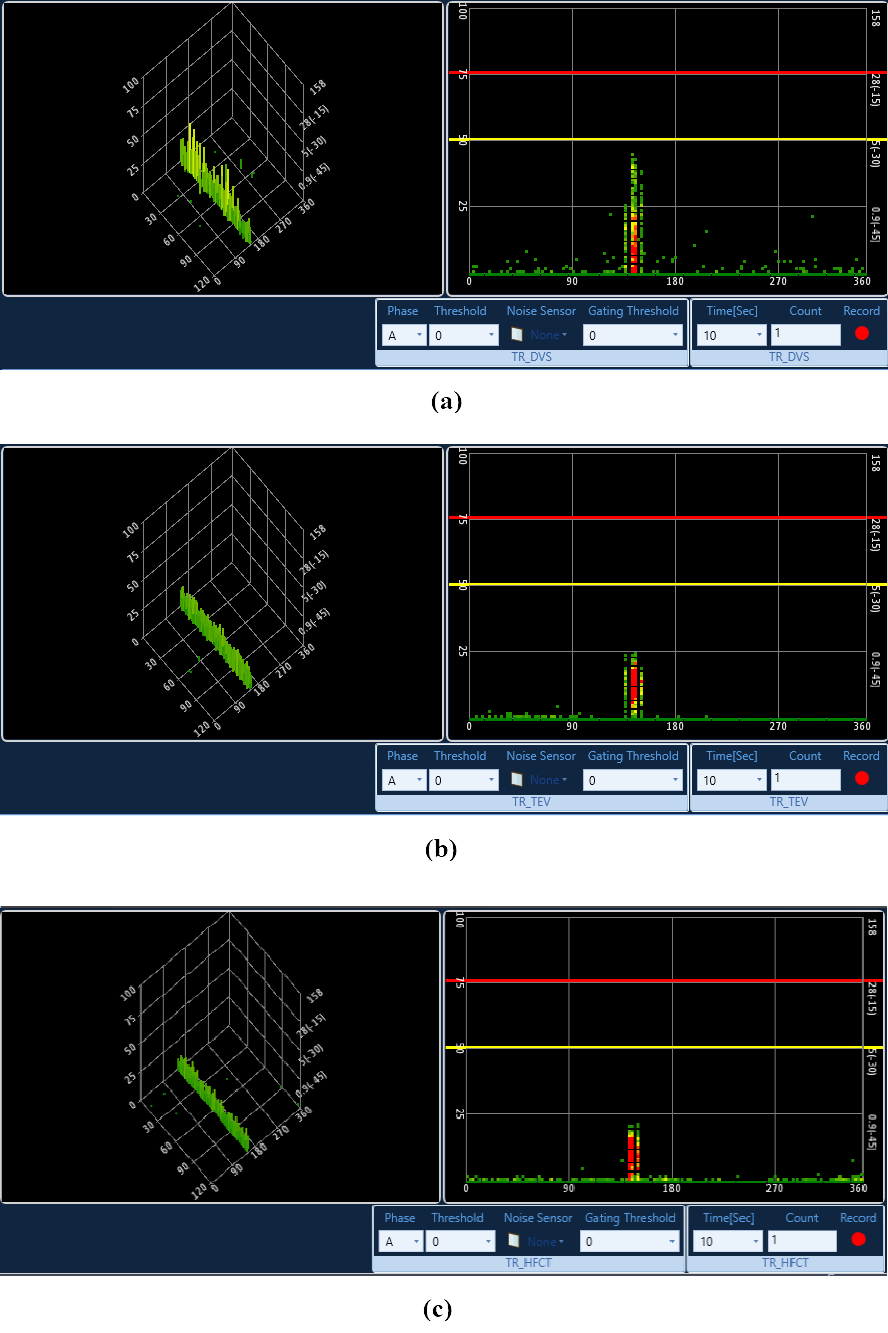
Fig. 4. (a) The PRPS Graph of PD Signal Detected by UHFTR (b) The PRPS Graph of PD Signal Detected by TEVTR (c) The PRPS Graph of PD Signal Detected by HFCTTR
Install an antenna inside the GIS mock-up and connect the PD generator to the antenna in order to generate a PD signal source inside the GIS mock-up and check that the PD signal is detected by the UHFGIS, TEVGIS and HFCTGIS installed in the GIS mock-up. At the same time, check whether PD signals are detected from UHFTR, TEVTR, and HFCTTR installed in the TR mock-up to check that PD signals generated inside the GIS mock-up are detected from the heterogeneous sensors installed in TR mock-up. If a PD signal is detected from one or more of the UHFTR, TEVTR and HFCTTR, the PD signal amplitude is compared after confirming whether the PD signal is in the same phase as the PD signal generated in the GIS mock-up. For example, if a PD signal is detected in the UHFTR, compare it to the amplitude of the PD signal detected in the UHFGIS. In addition, when a PD signal is detected in TEVTR, it is compared with the amplitude of the PD signal detected in TEVGIS, and when a PD signal is detected in HFCTTR, it is compared with the amplitude of the PD signal detected in HFCTGIS.
If the PD signal detected by the TEVTR or HFCTTR is in the same phase as the PD signal source generated in GIS mock-up and the amplitude is smaller than that of the TEVGIS or HFCTGIS, PD signal may be interpreted as generated from the outside rather than inside the TR mock-up.
The experimental method described above could distinguish a PD signal generated inside transformer from a PD signal generated in peripheral high voltage devices using several heterogeneous PD sensors, and in the next section, it shows the result through the experimental data.
3.2 Experimental Results
Figure 4 shows the analysis of PD signals detected by several heterogeneous sensors when PD signals source are generated using a PD generator in an antenna installed inside TR mock-up. Figure 4(a) shows the PD signal detected by the UHFTR in the PRPS graph, and Figure 4(b) shows the PD signal detected by the TEVTR in the PRPS graph. Figure 4(c) shows the PD signal detected by the HFCTTR in the PRPS graph. As shown in Figures 4(a), (b) and (c), when a PD signal source is generated inside TR mock-up, it can be seen that the PD signal detected by several heterogeneous sensors is in the same phase. As a result, it can be seen that the PD signal is detected by the UHFTR, TEVTR and HFCTTR, and the detected PD signal is the same phase, This confirms there is a PD signal generated inside the TR mock-up.
Figure 5 shows the analysis of PD signal detected by several heterogeneous sensors installed in GIS mock-up and TR mock-up when a PD signal source is generated using a PD generator in an antenna installed inside the GIS mock-up. Figure 5(a) shows the PD signal detected by the UHFGIS in the PRPS graph, and Figure 5(b) shows the PD signal detected by the TEVGIS in the PRPS graph. Figure 5(c) shows the PD signal detected by the HFCTGIS in the PRPS graph. At this time, Figure 5(d) shows the PD signal detected by the UHFTR in the PRPS graph, and Figure 5(e) shows the PD signal detected by the TEVTR in the PRPS graph. Figure 5(e) shows the PD signal detected by the HFCTTR in the PRPS graph. As shown in Figure 5(e), it can be verified that, when a PD signal source is generated using a PD generator inside a GIS mock-up, the PD signal is also detected by the TEVTR. When several heterogeneous sensors are installed only in TR mock-up, it is difficult to distinguish whether it is the PD signal generated from peripheral high voltage devices or the PD signal generated inside a transformer.
Figure 6(a) shows the PD signal detected by the TEVGIS in the PRPS graph. Figure 6(b) shows the PD signal detected by the TEVTR in the PRPS graph. Figure 6(c) shows the PRPS graph that logically removes the PRPS graph shown in Figure 6(a) from the PRPS graph shown in Figure 6(b) using pulse gating technology. Since the phase of the PD signal detected in TEVGIS and the PD signal detected in TEVTR are the same, and the amplitude of the PD signal detected in TEVTR is smaller than the amplitude of the PD signal detected in TEVGIS, no signal remains when logically removed using pulse gating technology.
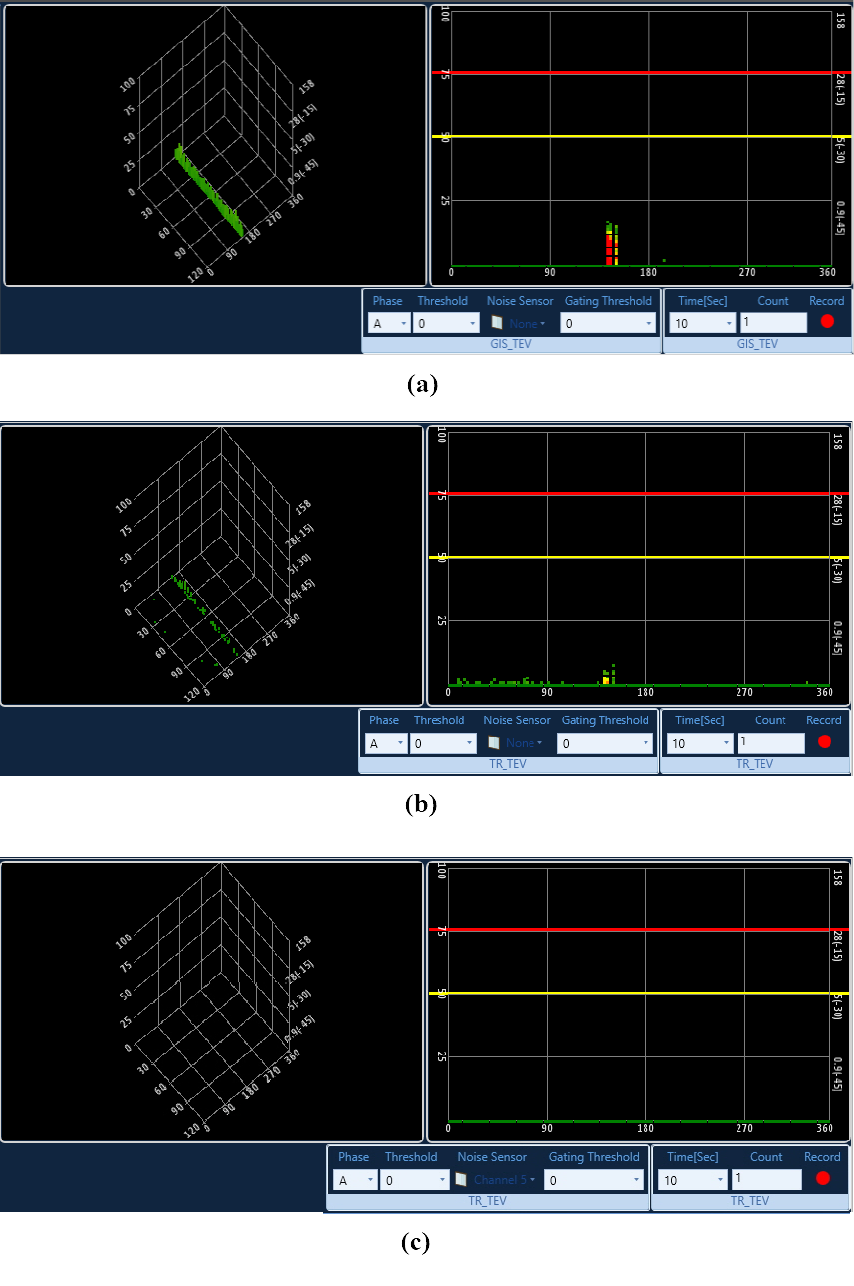
Fig. 6. (a) The PRPS Graph of PD Signal Detected by TEVGIS (b) The PRPS Graph of PD Signal Detected by TEVTR (c) The PRPS graph logically removed Figure 5(a) and Figure 5(b)
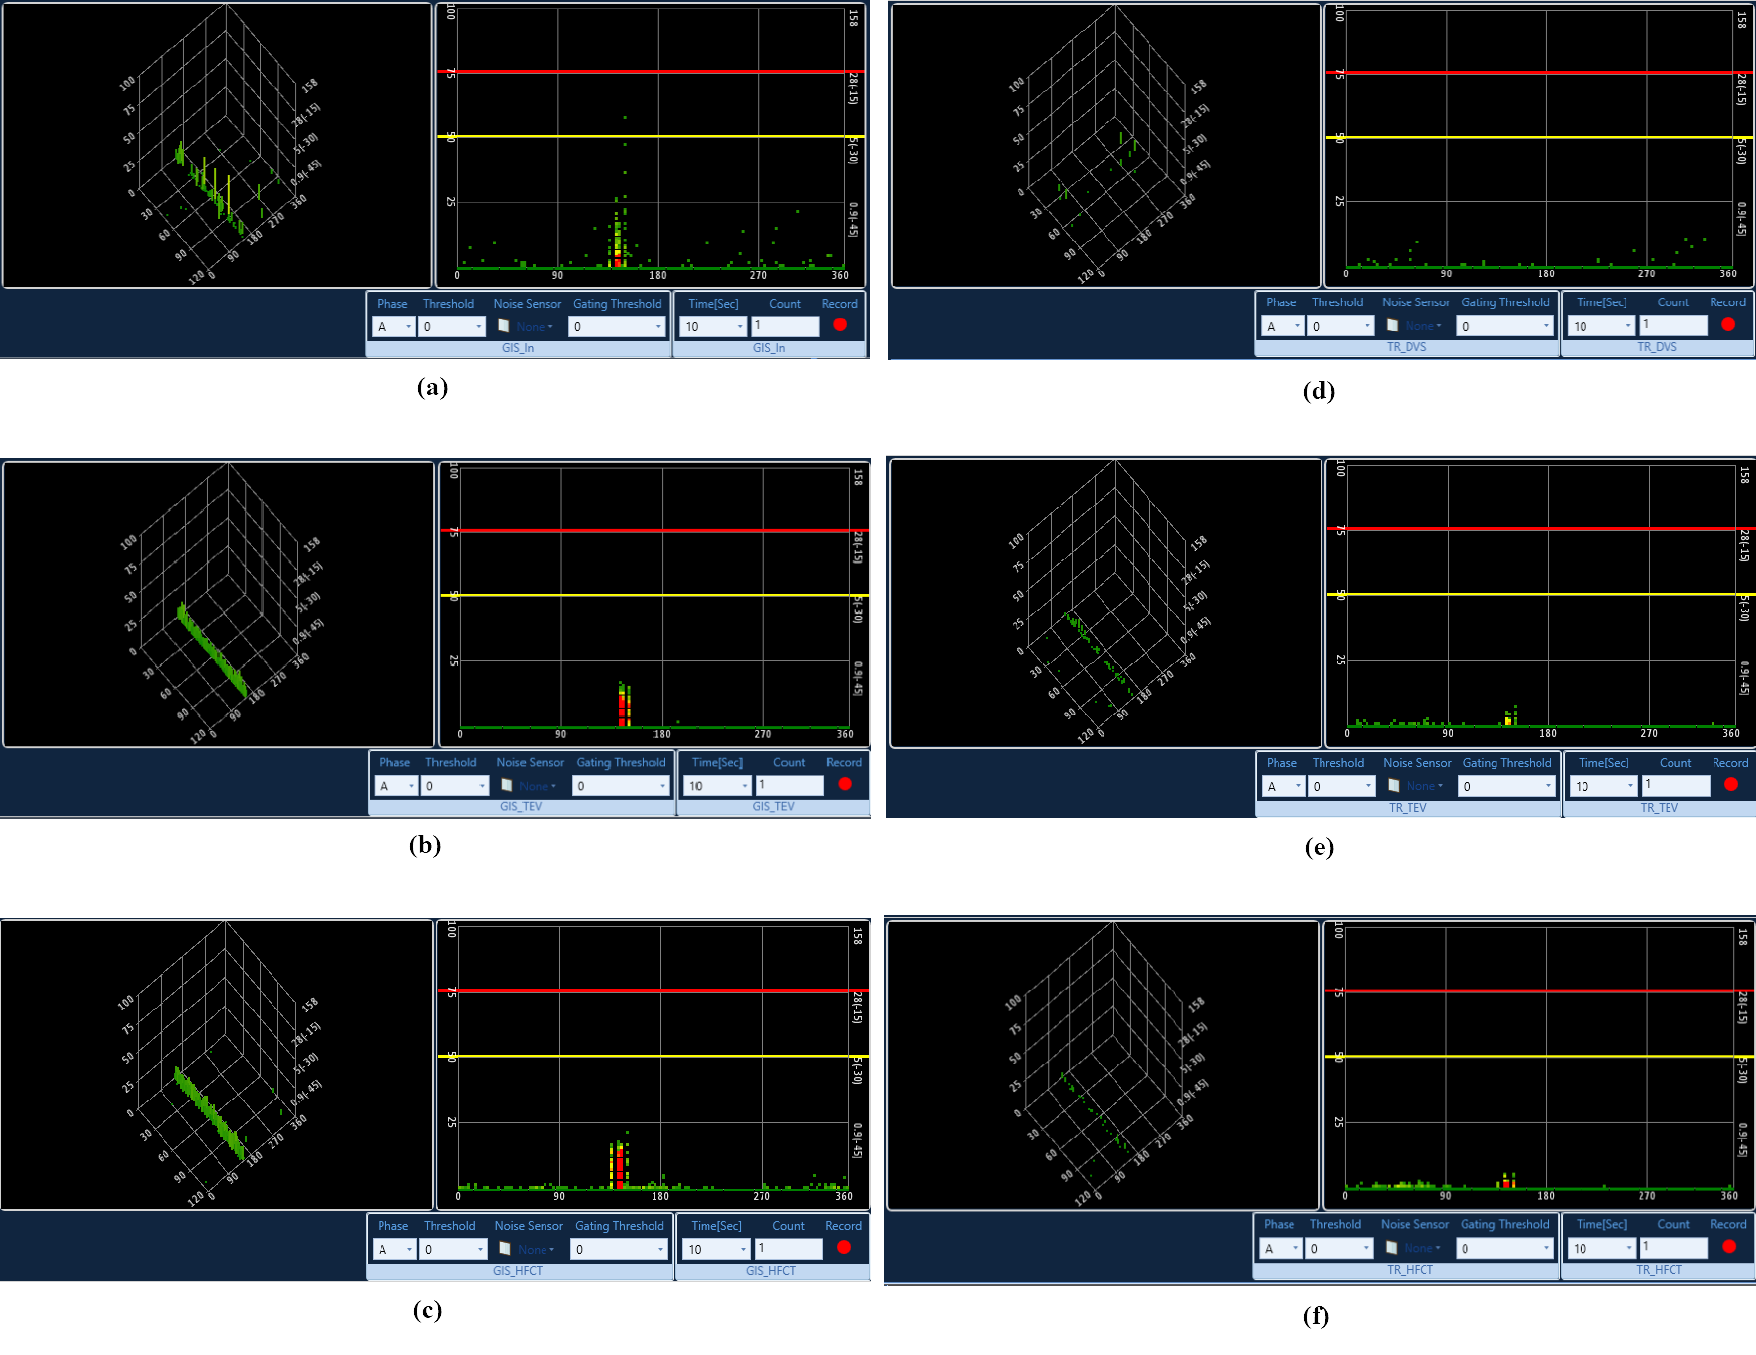
Fig. 5. (a) The PRPS Graph of PD Signal Detected by UHFGIS (b) The PRPS Graph of PD Signal Detected by TEVGIS (c) The PRPS Graph of PD Signal Detected by HFCTGIS (d) The PRPS Graph of PD Signal Detected by UHFTR (e) The PRPS Graph of PD Signal Detected by TEVTR (f) The PRPS Graph of PD Signal Detected by HFCTTR
This can effectively distinguish whether the detected PD signal source is from inside of TR or from external periperals devices.
4. Conclusion #
In this paper, we proposed a technique for installing several heterogeneous PD sensors in transformer and peripheral high voltage devices and comparing the normalized amplitude of PD signals received from each sensor in synchronized time and phase axes to distinguish PD signals from those generated inside the transformer. We have demonstrated the excellence of the proposed
We have demonstrated the excellence of the proposed technology to overcome the difficulty of distinguishing PD signals generated inside transformer and PD signals generated in peripheral high voltage devices, which are disadvantages of the conventional technology for detecting and analyzing electromagnetic waves through experiments. The proposed technology is expected to be useful for the analysis of only PD signals from inside of transformers.
ACKNOWLEDGMENTS
This work was supported by Korea East-West Power Co., Ltd.
References
-
- Dongjin Kweon. et al, “Development of management and operating System for Oil-immersed Transformer,” KEPCO Final Report, 2008.
- Associação Brasileira de Normas Técnicas (Brazilian Technical Standards Association), Técnicas de ensaios elétricos de alta tensão – medição de descargas parciais, NBR-6940 (High-voltage electrical testing techniques – measurement of partial discharges, NBR-6940), Brazil, 1981.
- S. Meijer, E. Gulski, J. J. Smith, & H. F. Reijnders, “Sensitivity Check for UHF PD Detection on Power Transformer,” 2004 IEEE International Symposium on Electrical Insulation, Indianapolis, 19-22 Sep. 2004.
- C. R. Li, W. Wang, Z. G. Tang & Y. S. Din, “PD Pattern Recognition in Transformer by Using UHF Technology,” 2004 IEEE International Symposium on Electrical Insulation, Indianapolis, pp. 19-22 Sep. 2004.
- R. A. Jongen, P. Morshuis, S. Meijer & J. Smit, “Identification of partial discharge defects in transformer oil,” 2005 annual report conference on electrical insulation and dielectric phenomena, Nashville in USA, pp. 565, Oct. 2005.
- S. Markalose, S. Tenbohlen, K. Feser, “Detection and Location of Partial Discharges in Power Transformers using acoustic and electromagnetic signals,” 2008 IEEE Transactions on Dielectrics and Electrical Insulation, pp. 1576-1583 Dec. 2008


