


Dr. Tarek M. M. Nasab
Lebanese International University
Saida, Lebanon
Abstract #
Effective planning of preventive maintenance work orders is crucial for the optimal performance and longevity of equipment and systems in various industries. This study investigates a strategic approach to scheduling preventive maintenance tasks by aligning them with common maintenance frequencies, synchronized execution hours, and consistent manpower allocation. The objective is to streamline maintenance operations, minimize downtime, and enhance overall efficiency. By analyzing historical maintenance data and identifying patterns in maintenance needs, the research proposes a model that groups work orders based on their frequency of occurrence, ensuring that tasks requiring similar intervals of attention are scheduled concurrently. Additionally, the model standardizes the execution hours for maintenance activities, allowing for better coordination and reduced disruption to operational workflows. The allocation of manpower is optimized to maintain a uniform number of personnel assigned to maintenance tasks, balancing the workload and preventing bottlenecks. The findings indicate that such an integrated planning approach can significantly improve the predictability and effectiveness of maintenance operations, leading to cost savings and improved asset reliability. This study provides a framework for maintenance managers to enhance their preventive maintenance strategies, ensuring that resources are utilized efficiently and maintenance activities are performed with minimal impact on productivity.
1 Introduction #
A Computerized Maintenance Management System (CMMS) provides a comprehensive database of all assets within an organization, including equipment, machinery, and facilities. This ensures that maintenance teams have accurate and up-to-date information about each asset. One of the key features of CMMS is the ability to schedule and automate preventive maintenance tasks. This helps in preventing breakdowns, reducing downtime, and extending the lifespan of equipment. By implementing a proactive maintenance strategy, organizations can save costs associated with reactive repairs and replacements. The conventional strategy for the CMMS is to repeat the maintenance cycle for issuing PM work orders as per the previous year with modifications as per the request; if exists. The proposed optimal automated designing process presents a strategy for the annual planning and workload distribution for work orders that will be based on the input database provided by the CMMS. This strategy is based on the forecasted time required for each PM equipment type plus the required manpower to execute the PM maintenance work for each equipment. A study case is presented that represent the practical application of this strategy on South Lebanese Water Establishment (SLWE) Foundation.
2 Advantages & Disadvantages of PM Grouping of Work Orders #
Grouping preventive maintenance work orders can have both advantages and disadvantages [1]. Here are some of them:
Efficiency and Time Saving:
|
Advantages |
Resource Optimization:
|
|
Consistency:
|
|
Cost Saving:
|
|
Overlooked Details:
|
Disadvantages |
Flexibility Challenges:
|
Disadvantages |
Complexity:
|
Disadvantages |
Table1. Advantages & Disadvantages of Grouping of PM Work Orders
Striking a balance between efficiency and flexibility is crucial to ensuring the effectiveness of preventive maintenance strategies.
3 Strategies & Approaches Application for Planning PM Work Orders for the Yearly Maintenance Cycle #
There are different strategies and approaches that can be used to plan work orders for the whole yearly maintenance cycle. Some of these strategies and processes represents the methods that are listed in Table 2:
| Calendar-Based Scheduling | It is a maintenance strategy where tasks are scheduled at regular intervals, regardless of the asset’s condition. This approach is often used when equipment requires regular maintenance to ensure reliable operation, even if there are no immediate signs of wear or failure. [2] |
| Condition-Based Maintenance (CBM) | It is a comprehensive and systematic approach to maintenance planning that focuses on preserving the function of critical assets while minimizing costs. The primary goal of RCM is to determine the most effective maintenance strategies to ensure that assets continue to operate reliably within their intended functions. This approach considers the different types of failures that can occur, the consequences of those failures, and the best ways to mitigate those risks. [3] |
| Run-Time-Based Scheduling | It is a maintenance strategy where tasks are scheduled based on the actual runtime of equipment or machinery, rather than on calendar time or condition. This method is particularly useful for equipment that operates under varying usage patterns, ensuring that maintenance is aligned with the actual wear and tear the equipment experiences. [4] |
| Task Grouping | It is a maintenance strategy where similar or related tasks are grouped together and scheduled to be performed at the same time. This approach is designed to optimize efficiency by reducing the frequency of maintenance activities, minimizing equipment downtime, and making better use of resources. [5] |
| Resource-Based Planning | It is a strategy where the scheduling of preventive maintenance (PM) work orders is driven by the availability of resources—such as personnel, tools, equipment, and materials—rather than by fixed time intervals or condition-based triggers. This approach ensures that maintenance tasks are planned and executed efficiently, using available resources optimally and avoiding delays due to resource shortages. [6] |
| Reliability-Centered Maintenance (RCM) | It is a comprehensive and systematic approach to maintenance planning that focuses on preserving the function of critical assets while minimizing costs. The primary goal of RCM is to determine the most effective maintenance strategies to ensure that assets continue to operate reliably within their intended functions. This approach considers the different types of failures that can occur, the consequences of those failures, and the best ways to mitigate those risks. [7] |
| Failure Modes and Effects Analysis (FMEA) | It is a systematic method for identifying potential failure modes within a system, assessing the causes and effects of those failures, and prioritizing actions to mitigate the risks associated with them. When used in planning preventive maintenance (PM) work orders, FMEA helps organizations focus their maintenance efforts on preventing the most critical and likely failures, thereby enhancing equipment reliability and safety. [8] |
Table2. strategies and approaches to plan work orders for the whole yearly maintenance cycle.
4 Optimal Automated Designing Process Strategy #
PM grouping and work order planning are crucial components of an effective maintenance strategy. They help in optimizing maintenance activities, reducing costs, and ensuring the reliability and safety of equipment throughout the maintenance cycle year.
Preventive Maintenance (PM) is a proactive approach that involves regularly scheduled inspections, adjustments, and replacements of equipment and systems to ensure optimal performance and prevent unexpected failures. A critical aspect of this approach is the grouping of work orders and planning them effectively throughout the maintenance cycle year.
PM grouping refers to the practice of organizing and consolidating similar or related maintenance tasks into a single work order or a group of work orders. This method is used to streamline maintenance activities, minimize equipment downtime, and optimize resource allocation. By grouping tasks that can be performed simultaneously or sequentially, maintenance teams can reduce the frequency of disruptions and improve overall efficiency.
Work order planning for the maintenance cycle year involves scheduling these grouped tasks at appropriate intervals, ensuring that all necessary preventive maintenance activities are completed within the planned cycle. This planning takes into account factors such as equipment criticality, manufacturer recommendations, historical performance data, and available resources.
Each asset/equipment may have up to four types of frequencies as shown in the table below:
| Type | Frequency | |
| 1 | Type One | Monthly |
| 2 | Type Two | Quarterly |
| 3 | Type Three | Semi-Annual |
| 4 | Type Four | Annual |
Table3. Types of Maintenance Frequencies
If such an asset/equipment has the four types of frequencies, then its highest frequency is the “Annual” one. If it has only types one and two, then its highest frequency is “Quarterly”, and so on. Other types of Frequencies may be added to above table for such certain equipment as per manufacturer recommendation.
The proposed optimal automated designing process consists of four main steps that represent the proposed strategy for the designing process. The input database that are listed in the equipment inventory, where the forecasted time required for each PM equipment type plus the required manpower are listed, represent the required data for this strategy. The strategy for the optimal automated designing process consists of two major steps.
The first step is to set-up the input database for all PM equipment. All the information per equipment are presented, as shown in Figure 1, as it will be considered as an input data for the software that will deal with these data. These data will be classified and re-arranged, as shown in Figure 2, in order to be set into groups.
As per the second step, each group consists of same equipment with same frequency, forecasted man-hours and required manpower. Besides, it is also possible to group different equipment together, but with the same frequency, forecasted man-hours and required manpower as well.
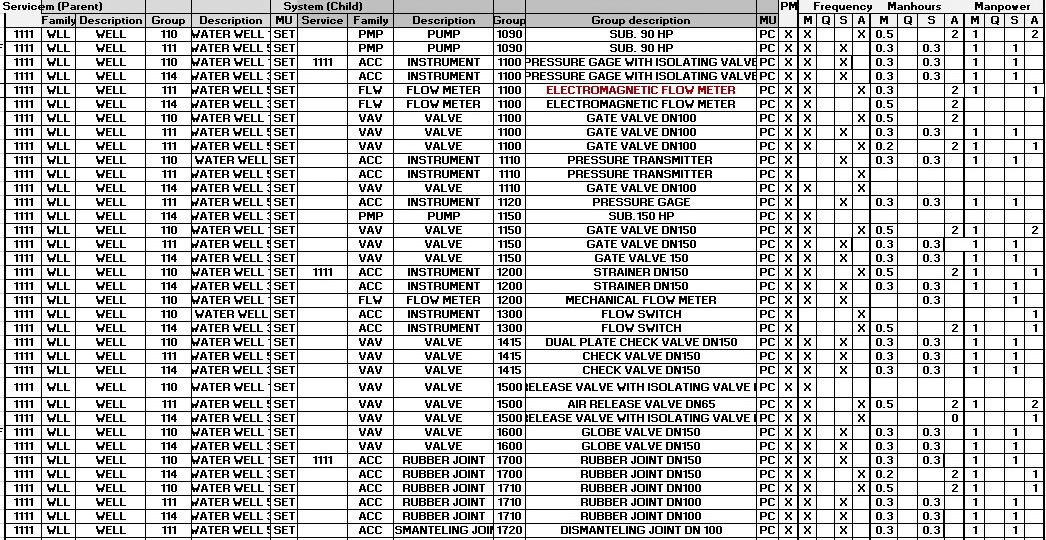
Figure 1: Partial listed data for Equipment Inventory for SLWE Foundation
The objective of the second step is to group the equipment as per its common frequency, forecasted man-hours and manpower as shown in the same Figure. For instance, and from Figure 2, the PM Group D100 represents 8 pumps with different types, but with the same frequency, forecasted man-hours and manpower. It is expected that 11 Monthly and one Annual work orders will be generated for the D100 PM Group.
Figures 2 presents the list of equipment that is related to a water substation that can be grouped and be fed as input data into the CMMS system. CMMS system will determine the number of equipment that can be assigned to one work order as per the available manpower. If the CMMS system is a homemade software, it can be modified to execute the process of this proposed input data design. Otherwise, an Excel file, for instance, can be used in order to set-up the data as shown in the previous figures, then be fed into the CMMS system. The purpose of this proposed strategy is to reduce the number of generated work orders per equipment that will result in reducing the required manpower to plan and execute them.
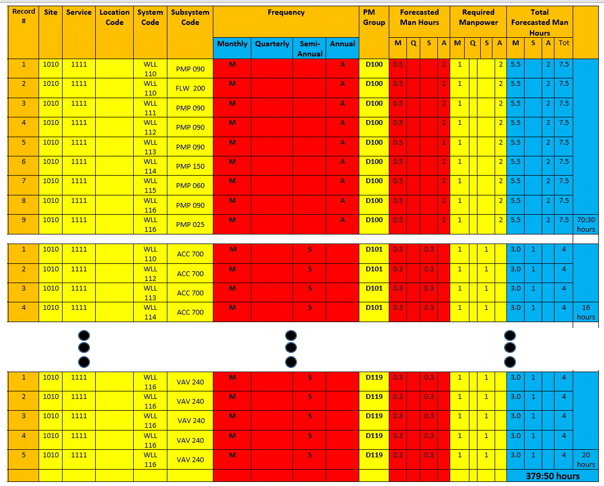
Figure 2: Grouped Equipment with common frequency, man-hours, & manpower
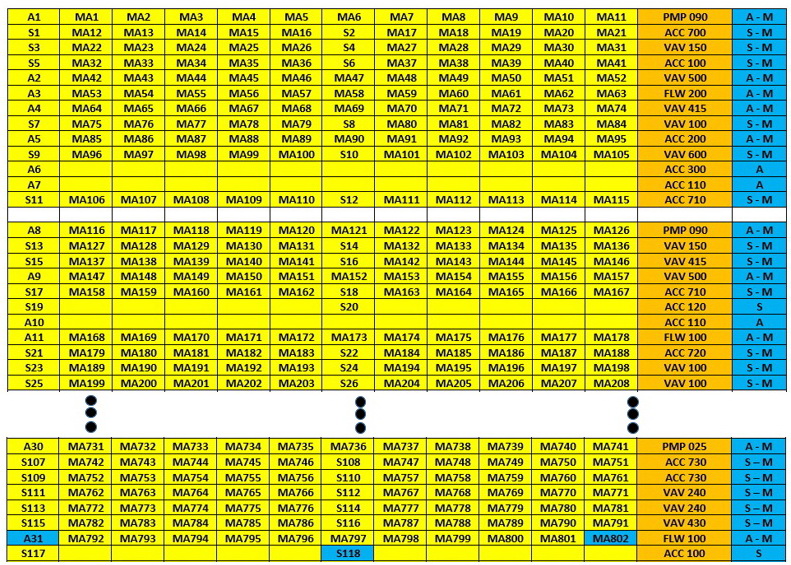 The third step is to determine the starting date of these planned PM Group work orders according to the highest frequency of each equipment as it is shown in Figure 3. Besides, the data for the Equipment inventory in above figures represent the partial data for the water substations that feed the Saida City and around villages with fresh water. A sample of this data were considered to demonstrate the proposed strategy for the optimal automated designing process for annual planning and workload distribution of work orders.
Figure 3: Work Order distribution according to the frequencies of each equipment
The fourth step belongs to the software itself to plan and distribute the PM Group work orders according to the starting date of each group as per its highest frequency, as shown in Figure 4. Besides, the software will also equally distribute the load of maintenance work, on an annual basis, according to a rhythm that will be presented as per Figure 7.
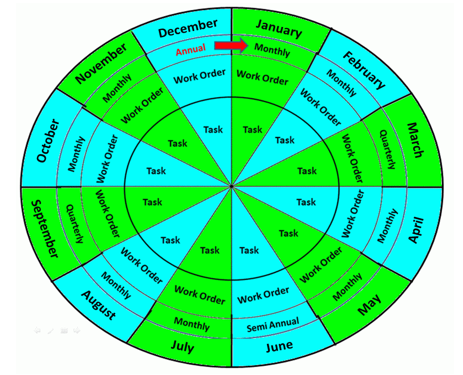
Figure 4: Maintenance Cycle Loop.
Figure 5, shows the pre-arrangement and post-arrangement data of the equipment inventory. The left side of the figure lists the PM Groups of the whole water substation, starting from PM Group D100 and ends with D119. On the right side of the figure, it lists all PM Groups of D100 together and so on till D119.
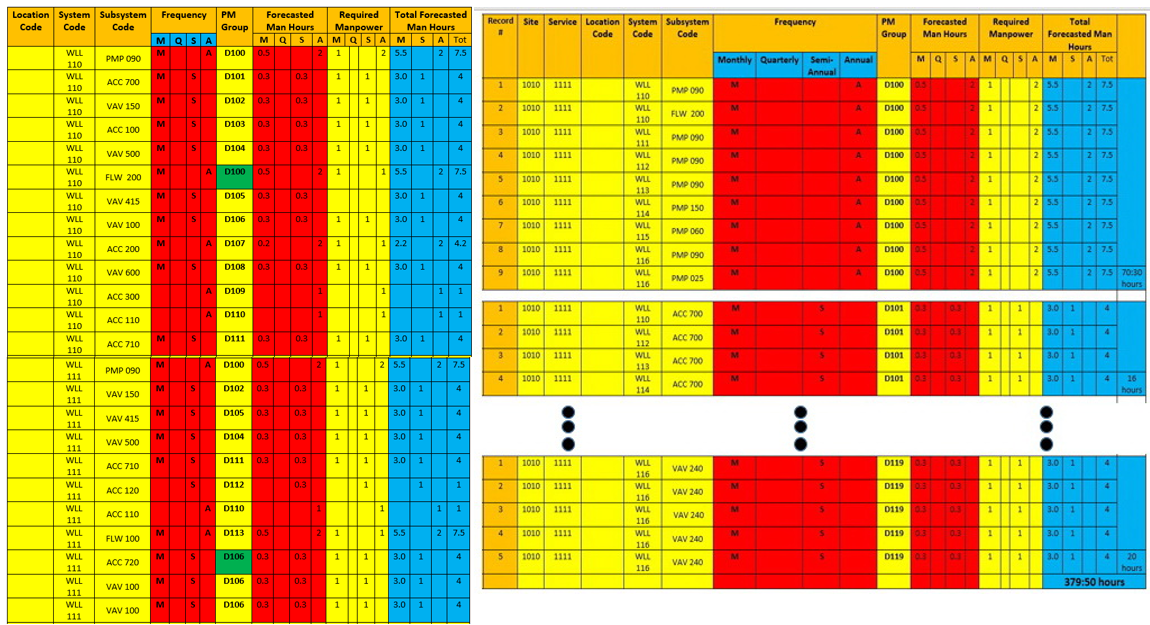
Figure 5: Pre and post data arrangement for the equipment inventory
The data that is shown in Figure 3 is then fed into the CMMS system in order to generate the work orders for each Group, D100 – D119. Next is to balance, per week, the distribution of the forecasted man-hours, and to balance the number of work orders per week as well. The annual work order distribution per week will start by considering the highest frequency per equipment. The rhythm of distribution of grouped work orders will starts as follows; the highest frequency for PMP 090, as shown in Figure 3 – first row, is Annual, where it is Semi-annual for ACC 700. The CMMS system will read the arranged data from Figure 3 and distribute according to the following algorithm. The 12 work orders for PMP 090, with annual highest frequency, will first start on week #1 of January with the annual work order “A1” and will be followed with MA1 on week #1 of February, then with MA2 on week #1 of March, and so on till distribution process reaches to MA11 on Week #1 of December. Same distribution will be done for the “S1” work order. S1 work order will be assigned to week #2 of January, then MA12 on week #2 of February, and so on till MA21 on week #2 of December. Besides, S5 will be assigned on week #4 of January, and will end up with work order MA41 on week #4 on December.
Next, a new distribution cycle will start with work order A2, 5th row of right table of Figure 6. It will start on week #1 of February, and MA51 will be assigned on week #1 on December, where MA52 will be assigned on week #1 of January. Same process is repeated for work order A5. It will start on week #1 of March, and so on till MA93 on week #1 of December, followed by MA94 on week #1 of January, and will end up with MA95 on week #1 of February. And so on till the complete of Figure 3 will be read and distributed according to the distribution algorithm planned for this optimal automated designing process of PM Group work orders.
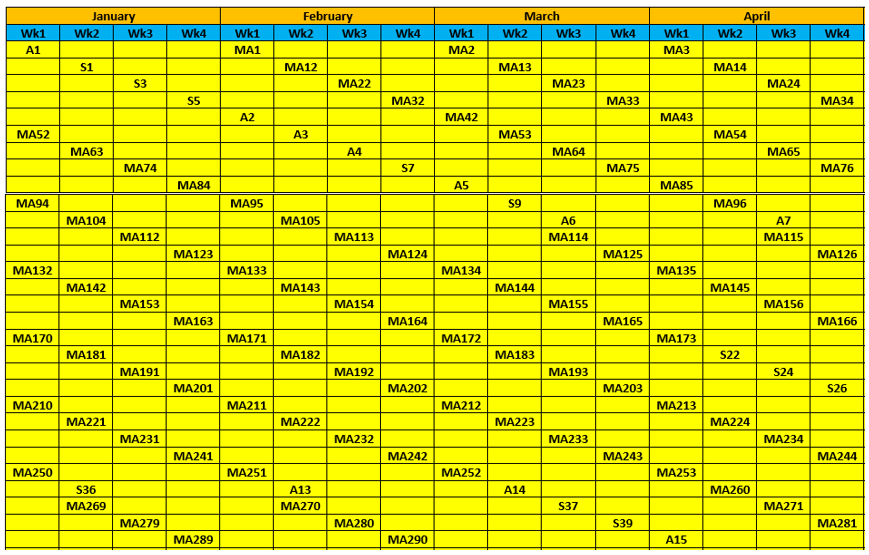
Figure 6: Weekly Work Order Distribution for the whole annual maintenance year.
The distribution of all PM Group work orders is partially shown in Figure 7. The huge data cannot be presented in a figure. Figure 7 shows the equally distributed PM Group work orders on a weekly basis. The range of weekly PM Grouped work orders is between 19 to 21 work orders. The results demonstrate the effectiveness of this proposed strategy.
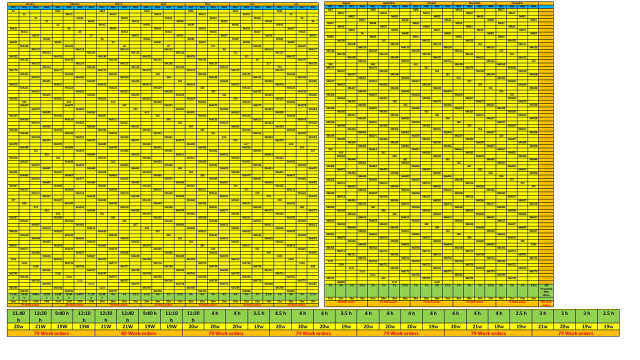
Figure 7: Totally equal distributed PM Group work orders on a weekly basis for whole maintenance year.
The numbers and types of the distributed PM Group work orders are shown in Figure 8. Instead of issuing 951 work orders for the active equipment at the Water Substation, only 119 PM Group work orders is issued and distributed across the executing schedule for the whole maintenance year.
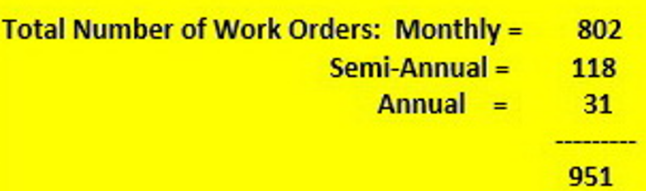
Figure 8: Numbers and types of the distributed PM Group work orders for the whole maintenance year.
5 Conclusion #
By implementing a systematic approach to PM planning of work orders, the annual maintenance workload can be evenly distributed across the year, ensuring consistent resource utilization and minimizing operational disruptions. By strategically grouping Preventive Maintenance work orders based on similar frequencies, same manpower requirements, and man-hours as well, it is possible to achieve a balanced and efficient maintenance schedule. This approach ensures that the workload is evenly distributed on a weekly maintenance calendar basis throughout the year, optimizing the use of resources and minimizing operational disruptions. The proposed strategy enhances productivity by aligning tasks that require similar resources, reducing the need for frequent adjustments in staffing or scheduling. Ultimately, this strategy promotes a smoother maintenance process, with predictable workloads that facilitate better planning, resource management, and overall operational efficiency.
References #
[1] Anthony Kelly, “Maintenance Strategy: Optimal Equipment Life-Cycle Decisions”, 2nd
edition, Butterworth-Heinemann, 2006.
[2] Richard D. Palmer, “Maintenance Planning and Scheduling Handbook”, 4th edition, McGraw-
Hill Education, 2019.
[3] R. Keith Mobley, “Condition-Based Maintenance and Machine Diagnostics”, 1st edition,
Butterworth-Heinemann, 1991.
[4] R. Keith Mobley, “Maintenance Fundamentals”,3rd edition, Elsevier, 2011.
[5] Don Nyman and Joel Levitt, “Maintenance Planning, Coordination, & Scheduling”, 1st
edition, Industrial Press, 2001.
[6] Alan Wilson, “Asset Maintenance Management: A Guide to Developing Strategy and
Improving Performance”, 1st edition, Industrial Press, 2002.
[7] Adolfo Crespo Márquez, “The Maintenance Management Framework”, 1st edition, Springer,
2007.
[8] Raymond J. Mikulak, Robin McDermott, and Michael Beauregard, “The Basics of FMEA”,
1st edition, Productivity Press, 1996.


