


Farhan M. Khan, Basil F. Bargaan, Mohammad S. AlRasheed Saudi Electricity Company
Abstract #
The Northern Operating Area is the weakest part of the of the SEC system. It is connected to rest of the system through only one 380kV double circuit interconnection. The Kingdom of Saudi Arabia has set out a roadmap to rapidly diversify the domestic power supply. In this regard a strategic initiative under vision 2030 has been taken up to maximize the potential of renewable energy in Saudi Arabia. As a part of this initiative 300MW Sakaka PV power plant has already been commissioned whereas 400MW Doumat Al Jandal Wind Power Plant is expected to be commissioned next year. Unlike conventional generation whose output can be controlled, renewable generation especially Wind/PV introduces variability and uncertainty in to the grid. This requires increased flexibility in the system. In the existing power structures around the world this flexibility is usually managed through conventional power plants. Use of storage technologies can also provide additional flexibility but its use is still limited due to various reasons. Integration of Wind/PV into the power system brings new challenges for the power system operator. Two time scales of concern here are minutes to hours timescale and hours to several days timescale. First one directly impacts the regulating reserve and ramping requirements whereas later impacts the production cost by reducing the efficiency of generation unit commitment and dispatch. Increased penetration can also lead to possible grid blockage or power flow management issues. A specific combination of renewable generation and load demand may change the magnitude and direction of power flow in the transmission system and further power flow in the interconnected grid. Primary objective of this paper is to identify the operational challenges that may be faced with integration both power plants in this area with focuses on determining reserve requirements for system balancing using statistical approach and identifying the combination of renewable generation & load demand that may lead to power flow management issues.
Keywords : RES Penetration, Regulating Reserves, SEC Grid, Data Analysis, Statistical Analysis
1 Introduction #
Some known challenges associated with Renewable integration on power system operation are transient stability, frequency and voltage control [1, 2]. Renewable energy especially wind and PV will introduce intermittency into the system operations. Limited predictability and increased uncertainty means that additional reserves will be required in the system to guarantee operational reliability [3,4]. With this increased variability conventional method of allocating spinning reserves equal to largest infeed or online generator are no more adequate. Extensive literature is available on various approaches to calculate spinning reserve with integration of renewable energy. One approach is to keep spinning reserve equal to the largest online generator or some portion of the standard deviation of net load or wind/PV forecast error or a combination of them [5 -9]. This approach has been used by Sweden in integrating wind power, reserve capacity margin on hydropower & thermal power is determined according to the forecast error of both wind power and loads [4]. Probabilistic method of reserve allocation is discussed in [10-13]. In this method Loss of Load Probability (LOLP) or Expected Energy Not Served (EENS) determines the spinning reserve requirement. This approach neglects the setting of reliability & rationality of such metrics. Ortega-Vazquez et al. [14] use a cost/benefit analysis to determine the optimal spinning reserve level for each time interval. These optimal spinning reserve levels are set as constraints in reserve constrained unit commitment. In [15], they add the uncertainty of wind power generation into the model. The Gaussian distribution of net demand forecast error is approximated by seven intervals. A capacity outage probability table (COPT) [16] is used to calculate the EENS of system. In [17], an artificial neural network model for wind generation forecast is presented and integrated in unit commitment. The probabilistic concept of confidence interval is used to account for the wind forecast uncertainty, but determining the optimal confidence level creates another difficult problem. stochastic optimization scheduling model considering wind power production as stochastic input is presented in [18], which makes use of a scenario tree tool to commit the scenario reduction and reschedules based on the most up-to-date forecast information.
Review of integration studies conducted in various parts of the world reveals that although type of operating reserves considered are similar but method to determine the quantum of reserves varies. Minnesota and New York Integration Studies [19, 20], Eastern Wind & Integration Study [21] and Hydro Qubec [22, 23] used statistical analysis, standard deviation of wind variability for regulating reserve calculations. Spain & Portugal used time-stepping Monte Carlo simulation for evaluating operation reserve strategies [24]. Netherland uses frequency domain peak to peak analysis [25]. Whereas Denmark uses Market based risk Model for this purpose [26].
Kingdom of Saudi Arabia has also setup an ambitious target of integrating 60GW of Renewable energy by 2030. As a part of this initiative 300MW Sakaka PV plant has already been commissioned whereas 400MW Doumat Al Jandal Wind Project is expected to be online next year. Both plants are located in the weakest part of the SEC grid. Each sub area within this area is only interconnected through a long 380kV Double circuit only. The objective of this paper is to identify the operational challenges with focus on regulating reserves & balancing requirements. Statistical analysis will be performed on generation production profile of wind/PV to determine expected regulation reserve. Similarly Load forecast of 2020 will be used to determine variability due to load. Renewable generation will be considered as negative load. Hourly regulating reserves based on net load variability will also be estimated using the same statistical approach.
2 Statistical Framework for Hourly Regulating Reserves Evaluation #
The statistical analysis can be used to evaluate power system reserve since it deals with characterizing the nature of random variables. . It is a good way of describing large amounts of data in an abbreviated way and to define important characteristics and properties of a given set of data. There are two key variables here, one is the variability of the electrical load other is the renewable generation. Both are expected to have several time frames of variability such as annual, seasonal, daily, minute-to-minute and second-to-second changes. Load demand and the power produced by renewable plants and their synchronous combinations are random variables. The variation in load is driven largely by consumer behavior, it has a distinct daily, weekly and seasonal trend that can be observed on time series of system load. The scope of this analysis is to determine how much variability exists in a set of given data, such as load, wind/PV production and their combination during a period of time (day, week, month, etc.). Considering the RES power and load time series, hourly variation within each time step can be calculated by taking the difference or “deltas” between successive data points. Hourly variability of load and RES power with time series of variations can be calculated using the following equations
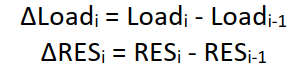
Where
ΔLoad is variability of load at hour i = 2,3,4…8760
ΔRES is variability of Renewable generation at hour i = 2,3,4…8760
The resultant time series will be concentrated around mean with residuals varying around the mean. From statistical theory; any sampling distributions based on large N can be approximated by the normal distribution even though the population distribution itself is definitely not normal. In probability theory, the normal distribution is a continuous probability distribution that is often used as a first approximation to describe real-valued random variables that tend to cluster around a single mean value

Where
μ is the mean
σ is variance (also known as measure of the width of distribution
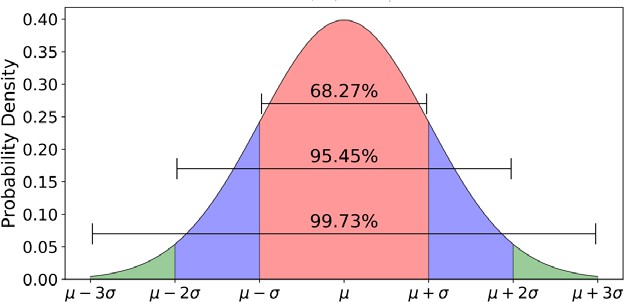
Figure-1 : Normal Distribution Curve
Figure 1 shows a normal distribution curve. About 2/3 of all cases fall within one standard deviation of the mean
P(μ-σ ≤ x ≤ μ+σ) =0.6826 About 95% of cases lie within 2 standard deviations of the mean
P(μ-2μ ≤ x ≤ μ+2σ) =0.9544 About 99.74% of cases lie within 3 standard deviations of the mean
P(μ-3σ ≤ x ≤ μ+3μ) =0.9974
Here Standard Deviation will be used as metric to describe the variability of the time series.
3 Statistical Analysis of Hourly Regulation Requirements #
The production variability of wind farms and PV plants has been carried out considering expected production profile of each plant. Hourly variability is calculated using hour by hour difference between the current production and the production in the previous hour. Approximating the distribution of the production variation as normal distribution, 99.7% of the samples is included in ±3σ. Here σ is evaluated for monthly samples and total population sample i.e. for the whole year. Statistics of the production variability monthly & annually for Wind farm, PV plant, Aggregate RES production (Sakaka + Doumat), Northeast area load demand, Northwest area load demand, Aggregate load demand (Northeast + Northwest) & Net Load is tabulated in table 1. The statistical value in which the typical hourly variations can be expected, is an appropriate driver for determining the regulating reserve of the system with RE plants. The hourly variation must be faced by the conventional plants operating on the system. It means that both NWA and NEA systems should be operated with an adequate amount of reserve on the regulating plants. In order to cope with the 99.7% of the expected hourly variation, the reserve of the entire NOA system must be at least ±340 MW. This reserve has to be allocated on plants with enough dynamic capacity of regulation: each plant must be capable to provide an adequate output power variation. The NOA is interconnected with the rest of SEC network. Also the interconnection could potentially provide the regulating service. In order to provide this kind of service, the interconnection must be of course operated with an adequate margin in respect to the security limitations (e.g. due to N-1 constraints).
Table-1 : Monthly & Annual Statistical Results for Hourly Variability
| Month | Hourly Up/Down Regulation in MW | ||||||
| Sakaka PV | Doumat Wind | Total RES | NEALoad | NWALoad | Total Load | Net Load | |
| Jan | 104 | 233 | 256 | 116 | 97 | 181 | 331 |
| Feb | 105 | 239 | 257 | 118 | 92 | 191 | 345 |
| Mar | 106 | 232 | 252 | 110 | 91 | 185 | 338 |
| Apr | 106 | 266 | 283 | 103 | 81 | 165 | 339 |
| May | 108 | 260 | 276 | 119 | 105 | 193 | 328 |
| Jun | 102 | 235 | 241 | 139 | 110 | 221 | 322 |
| Jul | 96 | 231 | 239 | 140 | 97 | 216 | 314 |
| Aug | 105 | 259 | 273 | 142 | 91 | 214 | 357 |
| Sep | 107 | 242 | 259 | 121 | 101 | 204 | 332 |
| Oct | 111 | 269 | 292 | 102 | 94 | 172 | 353 |
| Nov | 102 | 230 | 252 | 126 | 87 | 194 | 338 |
| Dec | 92 | 242 | 258 | 153 | 106 | 246 | 376 |
| Annual | 104 | 245 | 262 | 125 | 96 | 200 | 340 |
There are two aspects of Table-1 which is of our interest. One is the hourly RES production variability and the other one is the hourly net load variability.
A. Analysis of RES Production
Statistics of the production variability of the wind farm and PV plant is summarized in Table-1. Table-2 summarizes the production variability related to their installed capacity. Similarly the statistics for the total variation in NOA (combining production of both Wind & PV) is also tabulated.
Table-2 : RES Production Variability related Installed Capacity
| Duration | Hourly Variation as Percentage of Total production | ||
| Sakaka PV | Doumat Wind | Total RES | |
| Jan | 35% | 58% | 37% |
| Feb | 35% | 60% | 37% |
| Mar | 35% | 58% | 36% |
| Apr | 35% | 66% | 40% |
| May | 36% | 65% | 39% |
| Jun | 34% | 59% | 34% |
| Jul | 32% | 58% | 34% |
| Aug | 35% | 65% | 39% |
| Sep | 36% | 61% | 37% |
| Oct | 37% | 67% | 42% |
| Nov | 34% | 58% | 36% |
| Dec | 31% | 60% | 37% |
| Annual | 35% | 61% | 37% |
Annual variation for Doumat Al Jandal wind farm is about ±61% of the installed capacity. The variation tends to increase in April, May, August & Oct, whereas for the rest of the year it varies in the range of 58% – 60%. Sakaka PV plant production variability on the other hand varies in the range of 34% – 36%. Maximum variability is observed in May, September & October and lowest variability of 31% is observed in December. Whereas Annual variability remains ±35%. Interesting point to note here is that although wind variability is much but when combined with PV production, variability tends to decrease drastically. Annual aggregate RES production variability is only ±37% compared to wind farm production variability of ±61%. This shows that wind and PV production tends to reinforce each other.
B. Analysis of Net Load
Since renewable generation wind/PV is considered non dispatchable in most of the utilities around the world, therefore it can be considered as negative load. Net load represents load minus RES production. Hourly trend of Net Value is the algebraic sum of synchronized trend of load, wind & PV production. Figure 2 shows the hourly net load deltas on a histogram as frequency distribution. The yearly σNet Load of the load delta is 113 MW. Considering 3σNet Load coverage of the variability (and assuming that the load variation is normally distributed) is expected in 2020 that 99.7% of the Net Load deltas will be within ±339 MW/hr.

Figure-2 : Net Load Frequency Distribution of Hourly Differences
To understand the impact of RES generation on load demand and net load demand Figure 3 & 4 are shown. Figure 3 shows a typical load curve for a day with Peak load demand in NOA & figure 4 show a typical load curve for a day minimum net load.
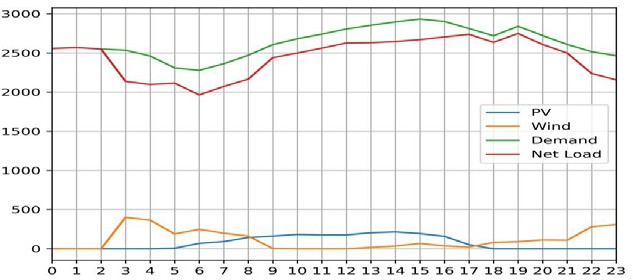
Figure-3 : Typical Day with Peak Load Demand in NOA
It can be seen in figure 3 that drop in drop in wind production is compensated by increase in PV production. Similarly during the evening when PV production is dropping wind production is picking up.
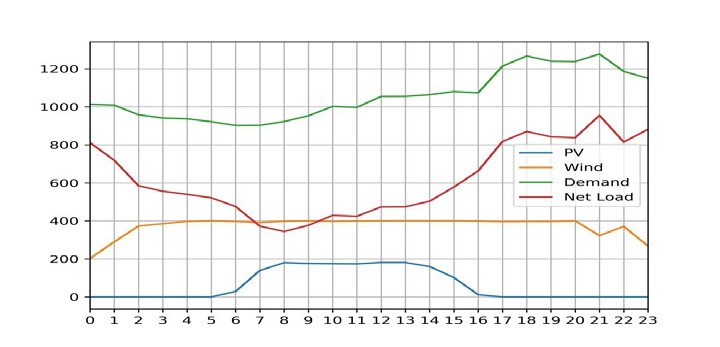
Figure-4 : Typical day with Minimum Net Load Demand in NOA
On the other hand figure 4 details one of the extreme scenario where maximum production is expected from RES during low demand period. Such scenarios will the most challenging one for power system operation and control with renewable integration. Maintaining Load-Generation balance with additional constraints such as restricted Net Transfer Capabilities and Minimum Must Run requirement will further complicate the problem.
4 Evaluation of Load Generation Balancing #
There is no standard practice regarding what share of wind/PV is considered low/high share [27]. This will depend on the power system characteristics. For instance in NOA while comparing the RES share (assuming maximum production of 700MW) with the peak load demand (2931MW), share is only 23.8%. However when load demand is plotted against expected RES production, RES shares at some instances can be as high as 60% as shown in figure 5. Generally shares of 20% – 25% are referred to as high shares. System operation becomes critical when operating at Res shares above 50%. There are considerable instances when in NOA RES share will be higher than 50%. Higher renewable energy share will have a direct impact on the optimal generation mix. One of the major aspect of RES integration is how this new power is added into the system. Whether it replace the existing generation fleet or optimized scenarios will be developed. Overall objective in SEC system is to develop optimized portfolios, however in NOA case it will be replacing existing convention generation in order to maintain Net Transfer limits. North Operating area is the weakest part of the SEC system. Each Area in NOA is only connected through 380kV double circuit transmission line. Net transfer capacity in this area are dictated by stability limits. Generation in this area is greater than total load demand of the area. Interconnection between NOA & COA provides a flexible way to maintain load generation balance in this area. However the capacity of this link is limited to 1000 MW only, owing to stability issues. Two gas based power plants one 500MW Plant in NWA & other 1280MW plant in NEA can easily cover load demand of this area along with the interconnection with COA.
However due to local stability issues several expensive plants have to be kept on bar as Must Run.

Figure-5 : RES Production Share as a function of NOA Load demand
Figure 6 shows duration of curtailment in number of hours. As expected curtailment has increased drastically with penetration of RES. Without RES integration maximum curtailment up to 500MW above stability limit was expected with a total duration of 2643 Hours. With RES integration maximum curtailment has increased up to 1050 MW above stability limit with a total duration of 4640 Hours. This corresponds to almost 6 months of curtailment. From the analysis it is clear that NOA lacks compressibility in terms of generation reduction. With the existing transmission infrastructure even integration of 700MW of RES can cause massive congestion issues on the interconnection with neighboring areas. Relieving of this congestion will either require curtailment of RES generation or reduction of cheap gas based plants. Reduction of conventional generation to accommodate RES has its own issues. This may lead to inertia reduction.
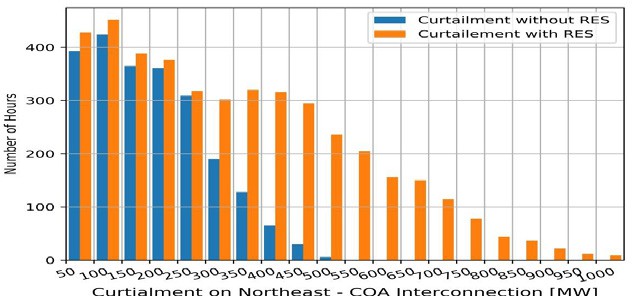
Figure-5 : Curtailment of Power in MW on NOA – COA Interconnection
6 Conclusion #
RES integration will introduce variability into the power system operation. This is primarily due to the natural factors affecting RES production which are complex to predict. This will bring new challenges which requires flexibility in the power system. Flexibility can be described as the ability of the power system to respond to changes in different time scales. A case study of NOA with integration of one wind and one PV plant is demonstrated in this paper. With the help of statistical analysis requirement of hourly regulation reserves are analyzed. Hourly regulating reserves of ±340MW will be required to covered variability associated with RES generation. Similarly optimal generation mix is expected to change as well. Critical situations like high wind/PV and minimum loads will be the most challenging. Most of the RES penetration is expected to remain between 0-30%. However there are instance when this value can reach up to 60%. Integration of RES may lead to congestions of power on NOA – COA interconnection for up to 4640Hours in an operational year. This means that either cheap gas based generation has to be reduced or RES generation has to be curtailed.
7 References #
- G. Lalor, A. Mullane, and M. O’Mally, “Frequency control and wind turbine technologies,” IEEE Trans. Power Syst., vol. 20, no. 4, pp. 1905–1913, Nov. 2005.
- P.B. Eriksen, T. Ackermann,H.Abildgaard, P. Smith, W.Winter, and J. M. R. Garcia, “System operation with high wind penetration,” IEEE Power Energy Mag., vol. 3, no. 6, pp. 65–74, Nov.–Dec. 2005.
- P.B. Eriksen, T. Ackermann,H.Abildgaard, P. Smith, W.Winter, and J. M. R. Garcia, “System operation with high wind penetration,” IEEE Power Energy Mag., vol. 3, no. 6,pp. 65–74, Nov.–Dec. 2005.
- L. Soder, “Reserve margin planning in a wind-hydro-thermal power systems,” IEEE Trans. Power Syst., vol. 8, no. 2, pp. 564–571, May 1993.
- M. H. Albadi and E. F. El-Saadany, “Comparative study on impacts of wind profiles on thermal units scheduling costs,” IET Renewable Power Generation, vol. 5, no. 1, pp. 26–35, 2011.
- M. A.Ortega-Vazquez andD. S. Kirschen, “Assessing the impact of wind power generation on operating costs,” IEEE Transactions on Smart Grid, vol. 1, no. 3, pp. 295– 301, 2010.
- X. S. Wu, B. H. Zhang, X. M. Yuan et al., “Solving unit commitment problems in power systems with wind farms using advanced quantum-inspired binary PSO,” Proceedings of the CSEE, vol. 33, no. 4, pp. 45–52, 2013 (Chinese).
- C. Wang, Y. Qiao, and Z. Lu, “A method for determination of spinning reserve in wind-thermal power systems considering wind power benefits,” Automation of Electric Power Systems, vol. 36, no. 4, pp. 16–21, 2012.
- K. Methaprayoon, C. Yingvivatanapong, W.-J. Lee, and J. R. Liao, “An integration of ANN wind power estimation into unit commitment considering the forecasting uncertainty,” IEEE Transactions
- J. Ge, F.Wang, and L. Z. Zhang, “Spinning reserve model in the wind power integrated power system,” Automation of Electric Power Systems, vol. 34, no. 6, pp. 32– 36, 2010 (Chinese).
- N. Menemenlis, M. Huneault, and A. Robitaille, “Computation of dynamic operating balancing reserve for wind power integration for the time-horizon 1–48 hours,” IEEE Transactions on Sustainable Energy, vol. 3, no. 4, pp. 692–702, 2012.
- W. Zhou, H. Sun, H. Gu, Q. Ma, and X. Chen, “Dynamic economic dispatch of wind integrated power systems based on risk reserve constraints,” Proceedings of the Chinese Society of Electrical Engineering, vol. 32, no. 1, pp. 47–55, 2012.
- M. A.Matos and R. J. Bessa, “Setting the operating reserve using probabilistic wind power forecasts,” IEEE Transactions on Power Systems, vol. 26, no. 2, pp. 594–603, 2011.
- M. Ortega-Vazquez and D. Kirschen, “Optimizing the spinning reserve requirements using a cost/benefit analysis,” IEEE Trans. Power Syst., vol. 22, no. 1, pp. 24–33, Feb. 2007.
- M. Ortega-Vazquez and D. Kirschen, “Estimating the spinning reserve requirements in systems with significant wind power generation penetration,” IEEE Trans. Power Syst., vol. 24, no. 1, pp. 114–124, Feb. 2009.
- R. Billinton and R. N. Allan, Reliability Evaluation of Power Systems, 2nd ed. New York: Plenum, 1996.
- K. Methaprayoon, C. Yingvivatanapong, W. J. Lee, and J. R. Liao, “An integration of ANN wind power estimation into unit commitment considering the forecasting uncertainty,” IEEE Trans. Ind. Appl., vol. 43, no. 6, pp. 1441–1448, Nov.–Dec. 2007.
- P. Meibom, R. Barth, B. Hasche, H. Brand, C. Weber, and M. O’Malley, “Stochastic optimization model to study the operational impacts of high wind penetrations in Ireland,”
- Richard Piwko, Xinggang Bai, Kara Clark, Gary Jordan, Nicholas Miller, and Joy Zimberlin. “The Effects of Integrating Wind Power on Transmission System Planning, Reliability, and Operations: Report on Phase 2,” Prepared for The New York State Energy Research and Development Authority, Mar. 2005. Available: http://www.nyiso.com/public/webdocs/services/planning/special_studies/wind_integration_report.pdf .
- Enernex Corporation, “2006 Minnesota Wind Integration Study Volume I,” Nov. 2006. Available: http://www.uwig.org/windrpt_vol%201.pdf.
- Enernex Corporation, “Eastern Wind Integration and Transmission Study,” Prepared for the National Renewable Energy Laboratory, January 2010. Available: http://www.nrel.gov/wind/systemsintegration/pdfs/2010/ewits_final_report.pdf.
- BPA Wind Integration Team: “Regulation, Load Following and Generation/Load Imbalance”, Study paper for the 2010 BPA rate Case, September 2008: http://www.bpa.gov/corporate/ratecase/2008/2010_BPA_Rate_Case/docs/TR10_WITStudyPaper_091008.pdf
- I. Kamwa, A. Héniche, M. de Montigny, “Assessment of AGC and Load-Following Definitions for Wind Integration Studies in Québec,” 8th International Workshop on Large-Scale Integration of Wind Power into Power Systems as well as on Transmission Networks for Offshore Wind Farms – Bremen, 14–15 Oct, 2009, Paper no. 129.
- C. J. Artaiz, M. I. Docavo, N. Martins, M. Rosa, M. N. Tavares, R. Ferreira, P. Cabral, M. Matos, A. Leite da Silva. Evaluación de los niveles adecuados de reserva de operación en los sistemas eléctricos ibéricos a medio y largo plazo. XIII Encuentro Regional Iberoamericano de Cigré, Argentina, 24-28 May 2009.
- J. Frunt, W.L. Kling, and P.P.J van den Bosch. Classification and quantification of reserve requirements for balancing. Electr. Power Syst. Res, accepted for publication 2010.
- T.K. Kristoffersen, P. Meibom, A. Gøttig, “Estimating Tertiary Reserves in the Danish Electricity System”. Proceedings of the 8th international Workshop on Large Scale Integration of Wind Power into Power Systems as well as on Transmission Networks for Offshore Wind Farms; 14.-15. October 2009, Bremen, Germany.
- Müller, S., Vithayasrichareon, P. (2017). “Getting wind and solar onto the grid. And IEA manual for policy makers.” In Proceedings of 16th international wind integration workshop WIW2017 Berlin 25-27 Oct 2017. Energynautics, Germany, 2017. Available at https://www.iea.org/publications/insights/insightpublications/Getting_Wind_and_Sun.pdf


