


Dr. Aziz U. Rehman, Isa H. Al-Mudaibegh & Ahmad A. Al-Shammari
Inspection Technical Support Division (ITSD) Inspection Department, Saudi Aramco Aziz.Rehman@aramco.com
Abstract #
Organizations measure or monitor KPIs and present this information at various operation stage for different levels of stakeholders and business managers. This becomes significantly complex and challenging when the requirement is to monitor multiple KPIs simultaneously. Higher level decisions are required to be made as to which KPIs are the most important and correctly represent the business unit activities. This leads to oversight, if multiple factors including priority and criticality of a certain KPI is not taken into consideration, and sometimes, the selected KPI can often reflect SME bias than the relevance with the business unit performance.
This article presents a risk-based approach in developing an un-biased composite KPI to measure and monitor performance. The emphasis is to derive a measurement index, which adequately reflects the performance indicators in accordance with their importance and criticality to operations
Keywords: Un-Biased, Operation Critical, Performance Measure
1 Introduction #
The global leader, such as Saudi Aramco, is continuously striving to improve quality, increase efficiency and enhance reliability, by empowering business units to react quickly to rapidly changing market environment for gaining competitive edge. Business units, through operational excellence, are tooled to self-monitor their performances and gauge achievements through internal comparison and external benchmarking. For thriving to become “Best-in-Class”, operating, management and business units rely heavily on information (or data), which plays a pivotal role in promoting continuous improvement. Accurate performance measurement dependent on information, which is of good quality, comparable, and most importantly, relevant to operational criticality.
It is a widely acknowledged fact [1-6] that performance measure of a complex entity, cannot be a single point index. It is multidimensional, which requires the measurement of several key indicators with a number of varied scales to capture each element. When an activity performance is measured through a simple relationship, the measurement process is usually quite straightforward, and activity performance is monitored to determine the status and to act (or not). However, when any activity may have more than one associated metrices, it becomes complex to visualize and measure the success or failure.
In oil and gas industry, it is common to measure the performance of every single activity or using the expert opinion and analysis to monitor performance of key indicators. It is counterproductive, from an executive perspective, to monitor, visualize and discuss the performance of every activity periodically and also risky to measure & visualize only the selected indicators. The conundrum is that monitoring performance of every relevant indicator is impossible, whereas, leaving a few or including some can also lead to the dilemma of improper performance representation and risk of affecting the long-term business objectives.
This work attempts in proposing a methodology to develop a composite performance measurement index, which represents multiple activities and combine them by taking into consideration their interdependence, cross relationship and operational criticality [7,8]. The approach is to take the subject matter expert (SME) and key stakeholder influences out-of-the-equation in combining the individual activities to arrive at a composite index, which adequately represents the performance of a business unit, within a global organization.
The use of composite index to measure or monitor performance is not new. There are multiple global entities in business and financial sector (e.g. Dow Jones, S&P, TSX, etc …), as well as in health and related sciences use composite indexes very effectively to monitor and visualize performances on a routine basis [4,5,9]. The focus of this work is to derive a performance index which is easy to visualize and flexible to handle, with a relative ease to change and accommodate the market needs, business requirements and operational criticality. Furthermore, the development is approached as top down, where the holistic performance is visualized and if required, separate combining elements can be monitored and tweaked for improvement.
2 The Performance Visualization through KPIs #
There are three distinct drivers, which encourage organizations for improving performance on a continuous basis – safety, environment and business or economic impact [7]. Measuring the performance of a business unit is becoming increasingly important because, unless we actually measure the performance, we cannot determine if improvements are being made [10-14]. Performance measurement contributes to improvement in a number of ways. It drives improvement through comparing the performance resulting in a desire to improve or maintain performance relative to others and reliability of services that they provide.
The key performance indicators (KPIs) are an invaluable tool that contribute immensely to the performance monitoring process. However, for KPIs to be effective, they need to have clear definition to ensure that the data collected is of high quality, i.e. consistent, reliable and most importantly relevant. Relevant KPIs measure what they are intended to measure and show a “right” performance picture and reliable KPIs will consistently produce the same result regardless of who performs the measurements. It is important to note that using performance indicators at a business unit level assists organization develop strategies, determine the gap between actual and targeted performance and estimate organization effectiveness and operational efficiency.
Business related and operation critical KPIs provide an objective way to see if the organization improvement strategy is working with a comparison that gauge the degree of performance change over time. They allow measurement of accomplishments with a common language for communication to help reduce intangible uncertainty. All this can be achieved, only if the KPIs are valid and configured by taking into consideration their criticality and relative importance. Hence, the famous saying, “If you can’t measure it, you can neither manage it nor improve it.”
3 Development of an Un-Biased & Operation Critical Composite KPI #
Development of an operation critical composite KPI requires the understanding of several (or all activities) within a business unit. These activities (denoted as sub-KPIs), can have independent and/or combined effect on service and support to operation, their interdependency as well as the relative importance and criticality.
3.1 Sub-KPIs and their Interdependence #
Consider an example of six activities (sub-KPIs). Figure 1 provides a schematic, with sub-KPIs (or activities) denoted as A-01, A-02, A-03, A-04 A-05 and A-06. The diagram (Figure 1) shows that how different activities can be interrelated and are interdependent, as follows:
- A-01 to A-05, all activities are somehow interrelated and dependent on others,
- A-06 is an independent activity, which is self-sufficient and didn’t depend on any other activity, and
- A-03 is the most connected activity, depending on the input or adequate functionality of four other activities (i.e. A-01, A-02, A-04 and A-05).
-
This illustration provides a snapshot of how important different activities are in relation to each other in an operating organization, hence emphasizes the fact that every activity cannot be considered equal when developing a composite KPI (Note: the small numerals, under each activity in Figure 1, denote the respective interdependence of each activity).
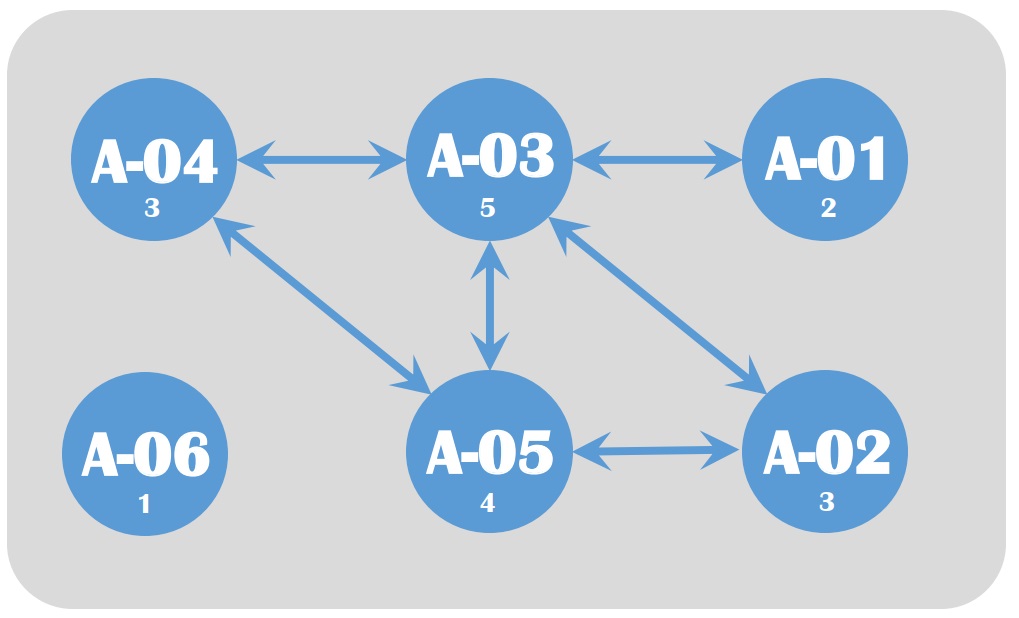
Figure 1: Explaining the Interdependency of sub-KPIs.
3.2 Criticality & Importance of Sub-KPIs #
Consider another example of same six activities (sub-KPIs), but this time their criticality to operations is considered. Figure 2 presents an example of operation criticality of different activities. Activities A-03 and A-06 are critical for business unit operation, whereas, the activities A-01 and A-04 are necessary with A-02 and A-05 having intermediate importance. A sub-KPI for any critical activity requires continuous monitoring for operational excellence and improvement (Note: the small numerals, under each activity in Figure 2 provide the critically index to different activities in an operating unit).
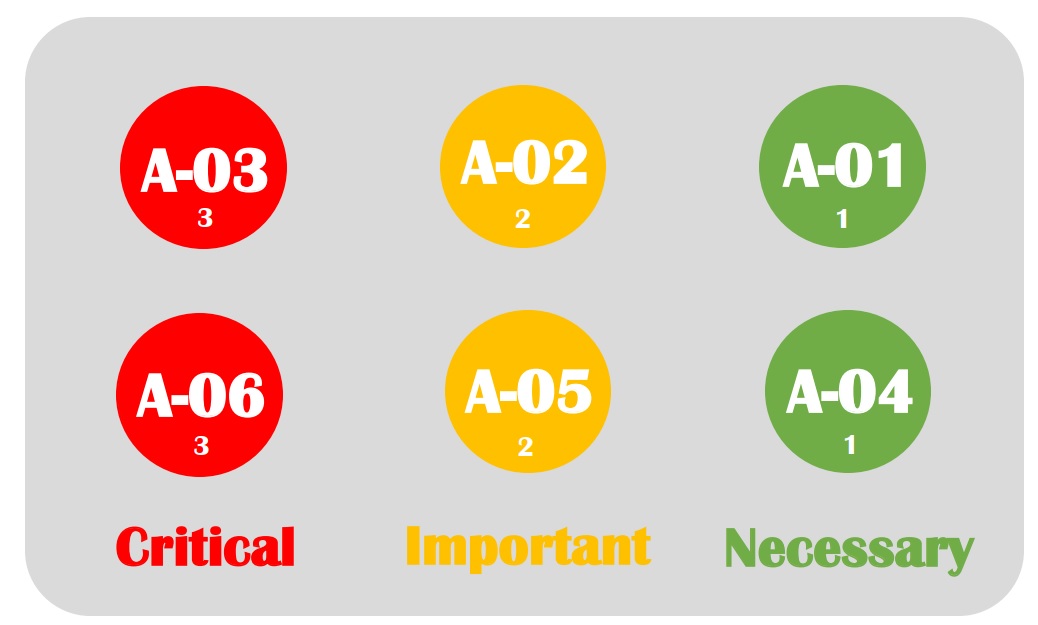
Figure 2: Operational Criticality of different sub-KPIs.
3.3 Relevance Index for each Sub-KPI #
Figure 1 and Figure 2 illustrated on how different activities are stacked in relation to each other, and their relative importance to operations. While embarking on developing a composite KPI for a business unit, following is considered as a “key” take-away from these examples:
- All activities (or sub-KPIs) within an operating unit are not equal, therefore, their interdependence must be considered carefully and weighed accordingly
- Operation criticality of each activity should be measured and accounted, while developing a composite KPI
-
With the understanding of risk analysis [6,7] a relevance index for each activity can be define as follows: ![]()
Example for Activity A-03:
R3 = D3 x C3
R3 = 5 x 3 = 15
where
D = Interdependence number, taken from the small numerals of Figure 1
C = Criticality, taken from the small numerals of Figure 2 and hence for the other activities
R1 = 2, R2 = 6, R4 = 3, R5 = 8 & R6 = 3
And Total Relevance (RT):
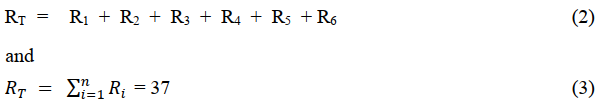
where i = 1 to n, and n = 6 in this case
and also
Relative Relevance (RRi) for each activity “i” is
![]()
3.4 Development of a Composite KPI #
Development of a composite KPI, representing multiple activities, requires relationship and relevance among activities. The interdependency and criticality, discussed above, will provide the basis for developing an equation for composite KPI. All activities, using their relevance as weighing factors, are summed as follows:
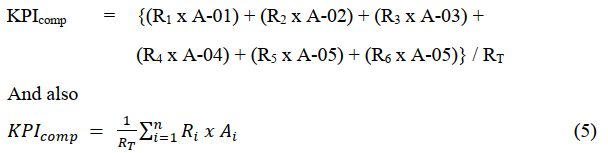
It is important to note that the information related to each activity, before using above equation to calculate the composite KPI, should be converted into the same measurement units (or scale). The preferred measurement unit for monitoring performance is “percentage”, therefore, the above equation can be re-written as follows:
![]()
The same equation (eq. 6) can also be define using Relative Relevance (RR) as:
![]()
4 Application to Performance Monitoring of Radiation Safety #
Radiation Safety Group of Inspection Department, Saudi Aramco performs numerous Radiation Protection (RP) activities on a routine basis, to support operating facilities. Following are some major RP activities, which are used to configure an un-biased & operation critical performance measurement index:
- RP01 Review of Radiation Safety Procedures
- RP02 Issuance of Radiation Work Permits
- RP03 Issuance of Radiation Storage Pit Permits
- RP04 Monitoring the use of Radiation Sources
- RP05 Import & Export of Radiation Sources
- RP06 Radiation Safety Training
- RP07 Radiation Safety Awareness Sessions
- RP08 Radiation Safety Assessments
- RP09 Radiation Safety Drills
- RP10 Radiography Service Provider RPO Approvals
As a first step in developing the un-biased & operation critical composite KPI is to collect input from all activity owners as well as the subject matter experts (SMEs) in the field of industrial radiography and radiation protection. The input will guide in understanding the interdependence and criticality of each RP activity, with reference to needs and requirements of operating facilities.
Table 1 provides the summary input from all activity owners and SMEs, with regards to the interdependence and criticality of radiation protection activities (Note: the ‘X’ in the table indicates the activity interdependence). The collected information is then used to calculate respective relevance (as defined in equation 1) of each activity, with total relevance (equation 3) and relative relevance (equation 4).
Table 1: Calculated Relevance of RP Activities
| Radiation Protection Activities | RP 01 | RP 02 | RP 03 | RP 04 | RP 05 | RP 06 | RP 07 | RP 08 | RP 09 | RP 10 | Dependency | Criticality | Relevance | Relative Relevance |
| RP 01 | X | X | 2 | 3 | 6 | 12 % | ||||||||
| RP 02 | X | X | X | 3 | 3 | 9 | 18 % | |||||||
| RP 03 | X | X | X | 3 | 3 | 9 | 18 % | |||||||
| RP 04 | X | X | X | 3 | 2 | 6 | 12 % | |||||||
| RP 05 | X | 1 | 2 | 2 | 4 % | |||||||||
| RP 06 | X | 1 | 2 | 2 | 4 % | |||||||||
| RP 07 | X | 1 | 1 | 1 | 2 % | |||||||||
| RP 08 | X | X | X | X | X | X | 6 | 1 | 6 | 12 % | ||||
| RP 09 | X | X | X | 3 | 1 | 3 | 6 % | |||||||
| RP 10 | X | X | 2 | 3 | 6 | 12 % | ||||||||
| Total Relevance (RT) | 50 | 100 % | ||||||||||||
5 Performance Monitoring of RP Activities #
Performance monitoring cannot be accomplished without defining a target. The performance targets for each RP activity should be set by considering the historical data, service criticality and value to operations. The relevance calculated in Table 2 provides the weightage of each activity in the composite KPI of equation (6) or equation (7). The same equation can be re-written to define the Radiation Protection Performance Index (RPPI), as follows:
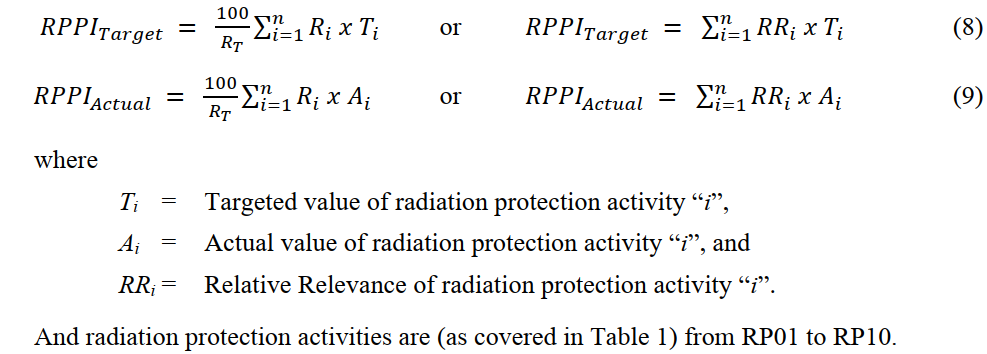
This radiation protection performance index development is now used to setup target and applied as a tool for monitoring performance of safety group RP activities. It is very important that this new methodology of performance measurement should be tested on historical performance data for radiation protection activities, before applying the same for continuous performance monitoring and improvement.
Table 2 provides an illustration of targets defined for each RP activity, with respective actual performance numbers from the 1st quarter of year 2014 of radiation safety group RP activities (Note: even though this quarter has missing data, but selected intentionally for this example to emphasis the significance of calculating relevance, discussed in the next paragraph). Target and actual performance numbers of each activity are then combined by using equation (8) and equation (9) to calculate the composite target and the composite performance index.
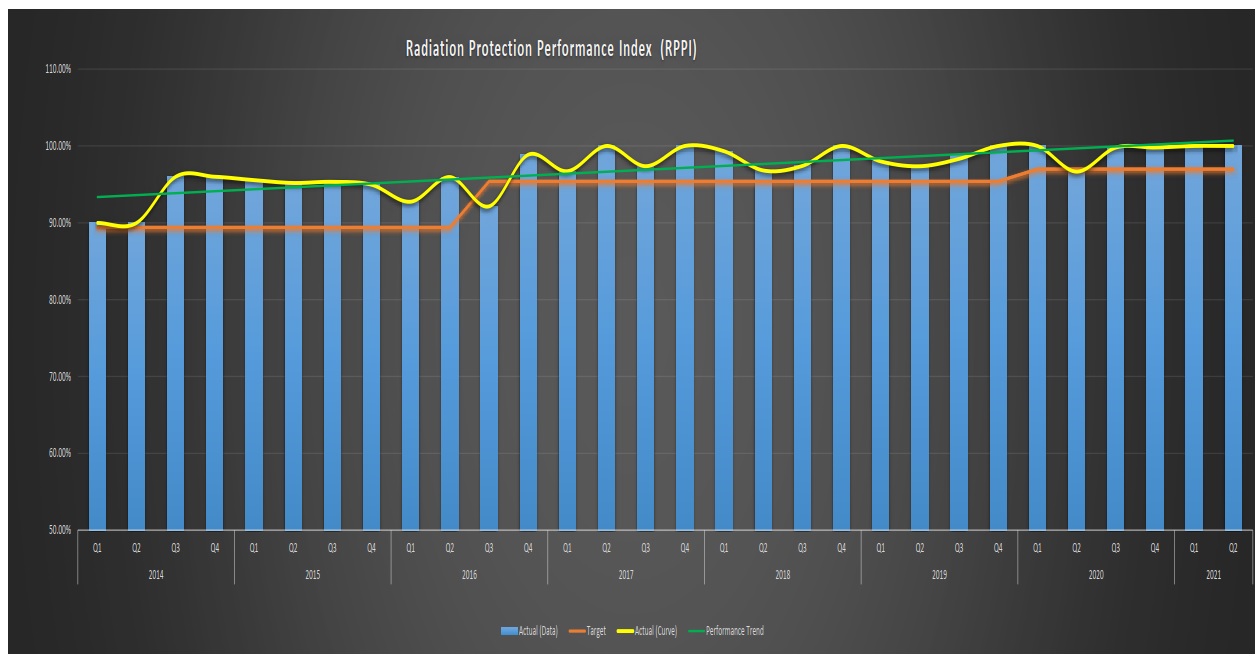
Using calculated target of 89.4%, the same analysis is now extended and applied across the historical data of thirty quarters (testing period from 1st quarter of 2014 to the 2nd quarter of 2021), to monitor holistic performance of radiation safety group through radiation protection performance index (RPPI). Figure 3 provides RPPI values over the testing period and compare the same with the pre-defined target. Note: the performance targets are revised in the 3rd quarter of 2016, to make it more challenging.
6 Top Level Inferences from Data and Trend Analysis #
Figure 3 provides a top-level view of radiation protection performance of radiation safety group RP activities (Note: the yellow curve in Figure 3 is line connecting data points presented as blue bars). A close analysis for actual RPPI numbers, provides with following information:
- RPPI values are meeting or exceeding the target,
- RPPI values over 1st 10 quarters are showing a positive trend (the green line in Figure 3), which allowed the user to comfortably re-calculate the targets (the red line in Figure 3).
- RPPI values for 2 quarters (Q1 and Q2) in 2014, as well as the 2nd Quarter of 2020 are barely meeting the targets.
Table 2: Calculated Composite KPI Target & Compared with Actual Performance
| Radiation Protection Activities | Dependency | Criticality | Relevance | Relative Relevance | Targets (%) | Actual (%) |
| RP 01 | 2 | 3 | 6 | 12 % | 90 | 100 |
| RP 02 | 3 | 3 | 9 | 18 % | 90 | 100 |
| RP 03 | 3 | 3 | 9 | 18 % | 90 | 100 |
| RP 04 | 3 | 2 | 6 | 12 % | 90 | 100 |
| RP 05 | 1 | 2 | 2 | 4 % | 90 | NDA* |
| RP 06 | 1 | 2 | 2 | 4 % | 100 | 100 |
| RP 07 | 1 | 1 | 1 | 2 % | 100 | 100 |
| RP 08 | 6 | 1 | 6 | 12 % | 75 | 100 |
| RP 09 | 3 | 1 | 3 | 6 % | 100 | 00 |
| RP 10 | 2 | 3 | 6 | 12 % | 90 | 100 |
| Total (Composite) | 50 | 100 % | 89.4 | 90.0 | ||
* NDA No Data Available
![]()
Figure 3: Comparison of RP Performance Index and Targets.
The radiation safety group radiation protection activities are meeting the performance targets, as defined by this development. However, the close scrutiny of the Figure 3 concurrently with Table 2 provides the following evidence:
- The analysis didn’t contain the data for activity RP05, and
- The activity RP09 has a score of “zero.”
Further analysis of the comparison provided the following additional information:
- The data recording and reporting was not applied for activity RP05 at that time, and
- The activity RP09 has a target of 3 occurrences per year, hence the score of “zero” for the quarter in question.
In addition, it is also extracted from Table 2 that the relative relevance of activity RP05 is only 4 %, with a dependency of 1 and criticality 2. In addition, on a relevance scale of 1 to 9, the relevance of RP05 is only 2, which make this activity relatively less relevant as compared to activities RP02 and RP03.
7 Benefits of an Un-Biased & Operation Critical Composite KPI #
The development of an un-Biased & Operation Critical Composite KPI carries several benefits:
- Reduces the influence of SMEs and activity owners for deciding on
- selecting activities to monitor performances, and
- assigning relative weightage (%), while configuring a composite KPI.
- The introduction and use of relative relevance
- increases the visibility of operation critical activities, and
- provide ‘right’ weightage (%) to individual activities comprising the composite KPI.
- Provide a dynamic and flexible method of performance monitoring by
- Including all operation critical activities in accordance with their relative relevance,
- offering possibility of including new activities, as and when they become operation critical or required to be monitored under regulations, and
- excluding activities, which are no longer performed by the unit or became non-obligatory through code revisions
8 Conclusion #
The use of clear, consistent and, most importantly, the relevant information is an important component of performance measurement, which involves monitoring the current level of performance and instituting changes where the performance is not in line with the predefined targets. However, it is important to recognize that the performance monitoring for a multidimensional entity is not straightforward and requires dealing carefully with operation criticality and influence of stakeholders for each activity. This is required to have the “right” performance picture, without any concern of manipulation and misinterpretation.
Composite performance indices are a beneficial communication instrument for conveying summary information in a relatively simple way. This effort of developing an un-biased & operation critical performance index has minimized the SME influence on proportionating different activities within the composition through relative relevance. The composite index offers a more rounded assessment of performance in presenting the big picture with the attention focused on operation critical activities.
The presented configuration is dynamic in nature and flexible to the varying operation needs, government regulations and industrial code requirement.
References #
- Rehman, A. U., Yami, M. H. & Mudaibegh, I. H., “Development of an Operation Critical Un-Biased Composite KPI to Measure Performance of Radiation Protection Activities,” Society of Petroleum Engineers, Annual Technical Symposium & Exhibition, Dhahran, Saudi Arabia, Apr. 23 – 26, 2018.
- Rehman, A. U., Yami, M. H., Hammad, R. G., Shammari, A. A., Zahrani, S. S., Zahrani, A. M., Omairi. K. S., & Mudaibegh, I. H., “Radiation Protection Activities Performance Measurements through the Development of an Operation Critical un-Biased Composite KPI,” 3rd Saudi Aramco SMS Technical Exchange Conference, Abqaiq, Saudi Arabia, Feb. 14 – 17, 2017.
- Rehman, A. U., Yami, M. H., & Zahrani, A. M., “Operational Critical & Un-Biased Performance Measurement of Radiation Protection Activities,” 3rd Technical Forum for Radiation Protection and Nondestructive Testing, Dhahran, Saudi Arabia, October 29, 2017
- Information and Quality Authority: “Guidance on Developing Key Performance Indicators and Minimum Data Sets to Monitor Healthcare Quality,” Dublin, Ireland, February 2013
- Jacobs, R., Smith, P. and Goddard, M.: “Measuring Performance: An Examination of Composite Performance Indicators,” CHE Technical Paper Series 29, The University of York, Centre for Health Economics, UK, March 2004
- Keyser, C.: “Composite Applications – The New Paradigm,” The Architecture Journal, Journal 10 (www.ArchitectureJournal.net)
- American Petroleum Institute Recommended Practice, API – 580, “Risk Based Inspection,” Revision February 2016
- American Petroleum Institute & American Society for Mechanical Engineers Standard, API RP 579-1/ASME FFS-1, “Fitness For Service,” 2nd Edition, June 2007
- S&P/TSX Canadian Indices Methodology, June 2016
- Roberts, H. V. and Sergesketter, B. F.: “Quality is Personal: A Foundation for Total Quality Management,”Free Press New York, May 2010
- Drummond, H.: “The Quality Movement: What Total Quality Management is Really all about,” London 1992
- Logothetis, N.: “Managing for Total Quality: from Deming to Taguchi and SPC,” New York, Prentice Hall, 1992
- Juran, J. M. and Godfrey, A. B.: “Juran’s Quality Handbook,” McGraw Hill, New York 1998.
- Deming, E. W.: “The New Economics for Industry, Government, Education,” MIT Press 2000.


